Review
. 2018 Mar 27;105(3-4):27.
doi: 10.1007/s00114-018-1551-3.

Polarisation vision: overcoming challenges of working with a property of light we barely see

Affiliations
Review

Polarisation vision: overcoming challenges of working with a property of light we barely see

James J Foster et al. Naturwissenschaften. .

Erratum in

Abstract

In recent years, the study of polarisation vision in animals has seen numerous breakthroughs, not just in terms of what is known about the function of this sensory ability, but also in the experimental methods by which polarisation can be controlled, presented and measured. Once thought to be limited to only a few animal species, polarisation sensitivity is now known to be widespread across many taxonomic groups, and advances in experimental techniques are, in part, responsible for these discoveries. Nevertheless, its study remains challenging, perhaps because of our own poor sensitivity to the polarisation of light, but equally as a result of the slow spread of new practices and methodological innovations within the field. In this review, we introduce the most important steps in designing and calibrating polarised stimuli, within the broader context of areas of current research and the applications of new techniques to key questions. Our aim is to provide a constructive guide to help researchers, particularly those with no background in the physics of polarisation, to design robust experiments that are free from confounding factors.

Keywords: Artefact; Imaging; Measurement; Methods; Polarisation; Vision.


Figures
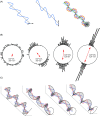
Fig. 1
Fig. 1
Visualising polarisation states. a Three beams of light propagating towards us along the same axis. Each has a different polarisation state. The left and centre panels show 100% horizontally and vertically polarised light. To the right is 0% polarised (unpolarised) light comprising waves that oscillate with a uniform distribution of angles. Shown as a coherent, monochromatic beam to aid visualisation (most light is incoherent: the waves do not have a defined relationship with one another). In (b) points on the outside of the circle represent randomly sampled angle distributions of a series of waves comprising a beam, and the arrow within the circle gives the resultant angle of polarisation. If the constituent waves oscillate in all directions, the beam is unpolarised, degree of polarisation ≈ 0 (left). The beam is partially polarised if the distribution of oscillation planes has an overall direction—its angle of polarisation (centre). The degree of linear polarisation describes the spread in values (precision of their centre). If all waves oscillate in the same plane, the light is completely linearly polarised: degree of polarisation ≈ 1 (right). (c) Circular polarisation and ellipticity, in waves shown as being made up of a vertical (red) and horizontal (blue) component. Ellipticity is governed by the relative phase (distance between peaks) between these two components. A phase difference of zero (or integer multiple of a half wavelength) results in (diagonally) linearly polarised light (left). Phase differences of a quarter of a wavelength give left-handed (left-centre) or right-handed (right-centre) circularly polarised light. Phase differences between these two limits give elliptically polarised light (right). In these example cases, the components’ amplitudes are identical
Fig. 2
Fig. 2
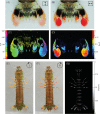
Polarising structures in stomatopods. a, b Structures on the telson of Odontodactylus latirostris linearly polarise reflected and transmitted light. Full colour images recorded through a vertically (a) and a horizontally oriented (b) linear polarizer, showing the long-pass filtering of horizontally, but not vertically polarised light (red pigment). c Angle of polarisation as calculated from a digital camera’s green channel (see Photographic Polarimetry), indicating that, at these wavelengths, light reflected from and transmitted through the telson is horizontally polarised. d Degree of linear polarisation across the telson, colour codes shown in adjacent colour bars. e, f Colour images of Gonodactylaceus falcatus recorded through a left-handed and right-handed circular polarizer, highlighting structures on the legs and telson that polarise light with a high degree of ellipticity (g)
Fig. 3
Fig. 3
A basic system for measuring the polarisation of light. a For measuring Stokes parameters S0–S2 the measurements are made with the polarizers oriented at 0°, 45°, 90° and 135°. b For measuring Stokes parameter S3 a combination of a quarter wave retarder and a polarizer at 45° and 135° is used
Fig. 4
Fig. 4
Example systems for measuring polarisation and the types of data they produce. a Photographic polarimetry using (i) a rotatable linear polarisation filter and (ii) a camera in full manual mode. False colour images (iii) can be used to represent the spatial distribution of polarisation. b Spectral characterisation of polarisation using (i) a Fresnel rhomb, (ii) an aperture, (iii) a rotatable Glan-Thompson polarizer, and (iv) a spectrometer. Polarisation characteristics may then be plotted against wavelength (v). Note: Stokes parameter calculations are only accurate where the intensity is sufficiently high (here: 470–570 nm). The noise at < 470 nm and > 570 nm is shown to illustrate the erroneous information resulting from insufficient intensity. c Simulated photoreceptors using (i) an aperture, (ii) an interference colour filter, (iii) a polarisation filter (in this case a polarising beam splitter), and (iv) photodiodes. Output can be simplified into a single measure of contrast between the two detectors (“model response”) (v)
Fig. 5
Fig. 5
Specular reflection of S- and P-polarisation. An unpolarised beam (red) that is specularly reflected from a smooth surface can be considered as a combination of two linearly polarised components. One of these is polarised parallel to the surface (s-polarised: green) and preserves more of its intensity on reflection (green double-headed arrow length) than the component polarised perpendicular to it (purple double-arrow length). The angle α illustrates that the angle of incidence is equal to the angle of reflection (grey shaded angle)
Fig. 6
Fig. 6
A twisted nematic (TN) panel that can be converted to an angle-of-polarisation monitor. a Schematic of TN LCD Monitor Layers. Illumination (red) from the monitor’s light source first passes through the rear polarizer, for which the transmission axis (green arrows) is perpendicular to the front polarizer. The long axes of the liquid crystal molecules (grey ellipses) twist through 90°, causing a 90° rotation of the AoP. As a result, the light is transmitted through the front polarizer. b When a voltage is applied, above a threshold, the molecules start to reorient, becoming perpendicular to the glass substrates. At a sufficiently high voltage, the 90° twist is completely removed, and the liquid crystal layer no longer rotates the AoP. As a result, the light is absorbed by the front polarizer. A change between 0° and 90°, via application of an intermediate voltage level, results in a pixel of intermediate brightness. c Imaging polarimetry (see How Polarised Light is Measured) showing red, green and blue sub-pixels in a TN panel (Dell 1908FPC) converted to an angle-of-polarisation monitor via removal of the front polarizer. Pixel byte values for 0 (black), 175 (grey) and 255 (white) shown, each producing a different AoP. Each pixel is 293 μm tall and wide (i.e. across the red, green and blue sub-pixels). d AoP and DoLP characterisation of the monitor’s output across the 256 interval input scale, showing the gradual change in rotation of the AoP of light as the input value increases (decreases in voltage for a TN panel)
Fig. 7
Fig. 7
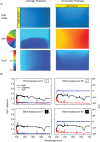
Scattering tank used to manipulate AoP. a True-colour and false-colour (polarisation) images of a scattering tank oriented to produce either vertically or horizontally polarised light. Light source and polarizer either to the side of the tank (left) or on top of the tank (right) producing vertically and horizontally polarised scatter, respectively. Colour images (top), photo-polarimetric images of angle of polarisation (middle), and degree of linear polarisation (bottom). b Spectral polarisation measurements, with a monitor displaying either white (top) or black (bottom) transmitted behind the tank. N.B. At the monitor’s emission peaks (e.g. 450 nm, 550 nm) the white unpolarised background reduces the observed DoP
Fig. 8
Fig. 8
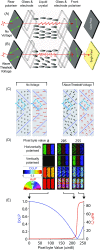
A patterned vertical alignment (PVA) panel that can be modified to act as a degree-of-polarisation monitor. a Schematic of PVA panel layers. The transmission axes of the rear and front polarizer are perpendicular, and a dark pixel is achieved by allowing the illumination (red) to pass through the liquid crystal unmodified. The indium tin oxide electrodes are depicted by the smaller rectangle inside the glass. b For different applied voltages, the liquid crystal layer retards output light to different extents, altering its DoLP. c Front view of a pixel, showing the liquid crystal alignment (grey ellipses) and polarisation state of output light (red arrows). The blue boxes indicate the area of the pixel represented in (a) and (b). The two diagrams show the cases of no voltage (left) and an above threshold voltage (right). For an above threshold voltage, linearly polarised light is converted to equal quantities of left and right-handed elliptically polarised light in the different domains of the chevron, which combine to cancel out, and change the DoP of the output light. At a particular voltage, the domains act as quarter-wave retarders, changing the polarisation into left and right-handed circular polarisation, which cancel to give a DoP of zero. d A modified DoLP monitor (Dell 1905FP) at the pixel level. Polarisation changes in PVA displays are complex, varying within domains in each pixel. Conversion of horizontally to vertically polarised light begins at intermediate byte values (e.g. 205), in the regions of the pixel domains in which the liquid crystal molecules tilt. In (a) to (d) the width of the electrodes is approximately 100 μm, and each pixel is 293 μm tall and wide. e Across most of the input range, the averaged AoP of the monitor’s output remains the same while DoLP decreases with increments in pixel byte value (i.e. increases in voltage for a PVA panel)
Fig. 9
Fig. 9
Contrast between reflected p- and s-polarised light. (Black) black acrylic (Perspex, Weybridge, UK). For angles of incidence 45–60° almost none of the p-polarised beam’s intensity is reflected light. (Orange) white acrylic (Perspex, UK). The difference in reflected intensity between s-polarised and p-polarised light is lower than for black acrylic. (Blue) the same block of black acrylic as above, sand-blasted to create a ‘rough’ surface. The increase in contrast with angle of incidence is more gradual than for untreated black acrylic. (Green) white felt (Fabric Land Ltd., UK). This material is both highly reflective and ‘rough’ (fibrous), and hence the contrast between reflected s-polarisation and p-polarisation is low at all angles. Raw measurements of reflected intensity available in the supplement (S5)
Fig. 10
Fig. 10
Comparison of reflected intensity of p- and s-polarised beams from a smooth (a) or fibrous material (b). a While a relatively large proportion of the intensity of s-polarised light (AoP into the page; intensity shown as size of the green circle) is preserved as the angle of reflection approaches Brewster’s angle (see Specular Reflections), reflected intensity of p-polarised light (AoP in the plane of the page; intensity shown as arrow length) decreases as a function of increasing angle of incidence, reaching a minimum at Brewster’s angle. b The same effects also occur in ‘rough’ or fibrous surfaces, but an observer at a given angle to the surface sees light that has been reflected at a greater diversity of angles, including those angles for which intensity of reflected p-polarised light is high (left beam)
Fig. 11
Fig. 11
Changes in polarizer transmittance with angle of incidence. a The arrangement in which the polarizer’s transmission axis (TA) is perpendicular to the axis of rotation—relative to the incident beam (parallel to the plane of incidence). For this arrangement, transmission is not modulated as a function of angle of incidence. b The arrangement in which the polarizer’s TA is parallel to the axis of rotation. For this arrangement the proportion of the incident beam’s intensity that is transmitted decreases as a function of the angle of incidence (see panel c). c The transmittance spectrum of a UV-grade polarizer (HNP’B, Polaroid, USA) recorded at a range of incidence angles in the orientation described in (a, b). For incidence angles  25°, there is a clear reduction in transmitted intensity when TA orientation is parallel to the axis of rotation (as compared with when the TA is perpendicular to this axis). For more details of the measurement apparatus see supplement S6
Fig. 12
Fig. 12
Intensity contrast between polarizer orientations. Michelson contrast in transmitted intensity between two adjacent polarizers with perpendicular transmission axes, at incidence angles 0°–60° (points: measured; line: fitted polynomial). Example maximum contrast sensitivity thresholds for model species (Felis sylvestris: Blake et al. ; Columba livia: Ghim and Hodos ; Apis mellifera; Bidwell and Goodman 1993) provided for reference
Fig. 13
Fig. 13
An illustrated example of a y-maze paradigm that might be confounded by polarised stimuli. In y-maze arm (a) vertically polarised stimulus light reflected from the chamber walls is brighter than that reflected from the floor. In arm (b) stimulus light is horizontally-polarised and the situation is reversed, making average brightness of the arm as a whole lower than for (a). In (c, d) the arena is lined with a rougher substance with a high diffuse reflectance, minimising these differences. In this scenario, projected off-axis transmitted illumination may act as an intensity confound. In y-maze arm (c) the transmission axis of the polarizer is vertical, and hence transmitted light that illuminates the chamber’s vertical walls is darker than that which illuminates the chamber’s horizontal floor. In y-maze arm (d) the polarizer’s transmission axis is horizontally oriented, and the pattern is reversed
Fig. 14
Fig. 14
Collimating stimulus light. A collimating lens can be used to control the spread of a stimulus beam, so that the study animal observes stimulus light that is at normal incidence to the polarizer. Note that while some stimulus light is scattered by the diffuser, the spread is narrower than was the case for the initial light source

References

    1. Able KP, Able MA. Daytime calibration of magnetic orientation in a migratory bird requires a view of skylight polarisation. Nature. 1993;364:523–525.
    1. Arwin H, Magnusson R, Landin J, Järrendahl K. Chirality-induced polarisation effects in the cuticle of scarab beetles: 100 years after Michelson. Phil Mag. 2012;92:1583–1599.
    1. Bainbridge R, Waterman TH. Polarised light and the orientation of two marine Crustacea. J Exp Biol. 1957;34:342–364.
    1. Bidwell NJ, Goodman LJ. Possible functions of a population of descending neurons in the honeybee’s visuo-motor pathway. Apidologie. 1993;24:333–354.
    1. Blake R, Cool SJ, Crawford MLJ. Visual resolution in the cat. Vis Res. 1974;14:1211–1217. - PubMed

LinkOut - more resources