

Phenotype risk scores identify patients with unrecognized Mendelian disease patterns
- PMID: 29590070
- PMCID: PMC5959723
- DOI: 10.1126/science.aal4043
Phenotype risk scores identify patients with unrecognized Mendelian disease patterns
Abstract
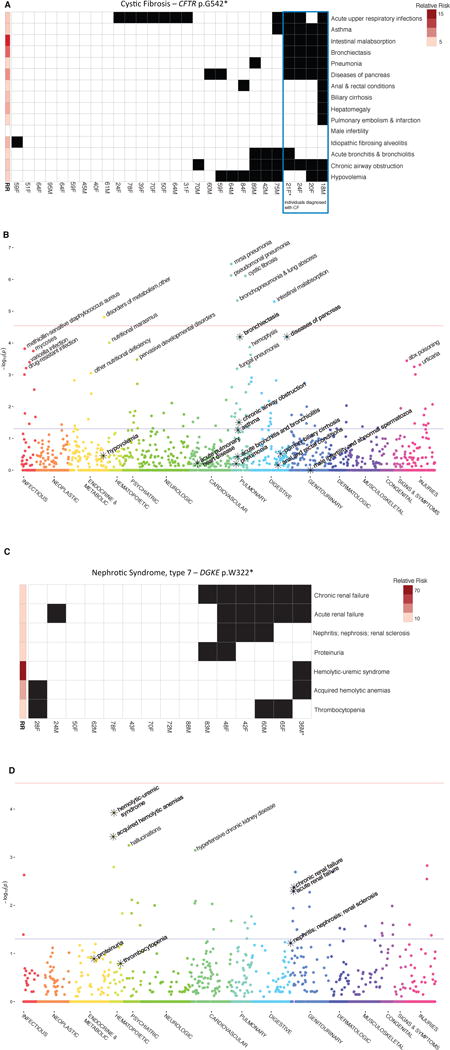
Genetic association studies often examine features independently, potentially missing subpopulations with multiple phenotypes that share a single cause. We describe an approach that aggregates phenotypes on the basis of patterns described by Mendelian diseases. We mapped the clinical features of 1204 Mendelian diseases into phenotypes captured from the electronic health record (EHR) and summarized this evidence as phenotype risk scores (PheRSs). In an initial validation, PheRS distinguished cases and controls of five Mendelian diseases. Applying PheRS to 21,701 genotyped individuals uncovered 18 associations between rare variants and phenotypes consistent with Mendelian diseases. In 16 patients, the rare genetic variants were associated with severe outcomes such as organ transplants. PheRS can augment rare-variant interpretation and may identify subsets of patients with distinct genetic causes for common diseases.
Copyright © 2018 The Authors, some rights reserved; exclusive licensee American Association for the Advancement of Science. No claim to original U.S. Government Works.
Figures


Comment in
-
Understanding genetic disease with electronic medical records.Nat Med. 2018 Jul;24(7):898. doi: 10.1038/s41591-018-0121-8. Nat Med. 2018. PMID: 29988133 No abstract available.
-
Understanding genetic disease with electronic records.Nat Med. 2018 Dec;24(12):1781. doi: 10.1038/s41591-018-0283-4. Nat Med. 2018. PMID: 30523316 No abstract available.
References
-
- Langlais D, Fodil N, Gros P. Annual Review of Immunology. 2017;35:1–30. - PubMed
Publication types
MeSH terms
Grants and funding
- UL1 TR000445/TR/NCATS NIH HHS/United States
- T32 HG008341/HG/NHGRI NIH HHS/United States
- S10 OD023475/OD/NIH HHS/United States
- T15 LM007450/LM/NLM NIH HHS/United States
- R01 HL136748/HL/NHLBI NIH HHS/United States
- R01 LM010685/LM/NLM NIH HHS/United States
- U01 HG004603/HG/NHGRI NIH HHS/United States
- R01 HL140074/HL/NHLBI NIH HHS/United States
- R01 HL133786/HL/NHLBI NIH HHS/United States
- U01 HG006378/HG/NHGRI NIH HHS/United States
- UL1 RR024975/RR/NCRR NIH HHS/United States
- UL1 TR002243/TR/NCATS NIH HHS/United States
- U01 HG009086/HG/NHGRI NIH HHS/United States
- R01 MH113362/MH/NIMH NIH HHS/United States
- U01 HG008701/HG/NHGRI NIH HHS/United States
- F32 HL137385/HL/NHLBI NIH HHS/United States
- R01 GM120523/GM/NIGMS NIH HHS/United States
- T15 LM007359/LM/NLM NIH HHS/United States
- U01 HG007674/HG/NHGRI NIH HHS/United States
- U01 HG008672/HG/NHGRI NIH HHS/United States
- 16FTF30130005/AHA/American Heart Association-American Stroke Association/United States
- R01 GM114128/GM/NIGMS NIH HHS/United States
- P50 GM115305/GM/NIGMS NIH HHS/United States
LinkOut - more resources
Full Text Sources
Other Literature Sources
Medical
