. 2018 Mar 16;359(6381):1259-1263.
doi: 10.1126/science.aan6042.

GDV1 induces sexual commitment of malaria parasites by antagonizing HP1-dependent gene silencing

Affiliations

GDV1 induces sexual commitment of malaria parasites by antagonizing HP1-dependent gene silencing

Michael Filarsky et al. Science. .

Abstract

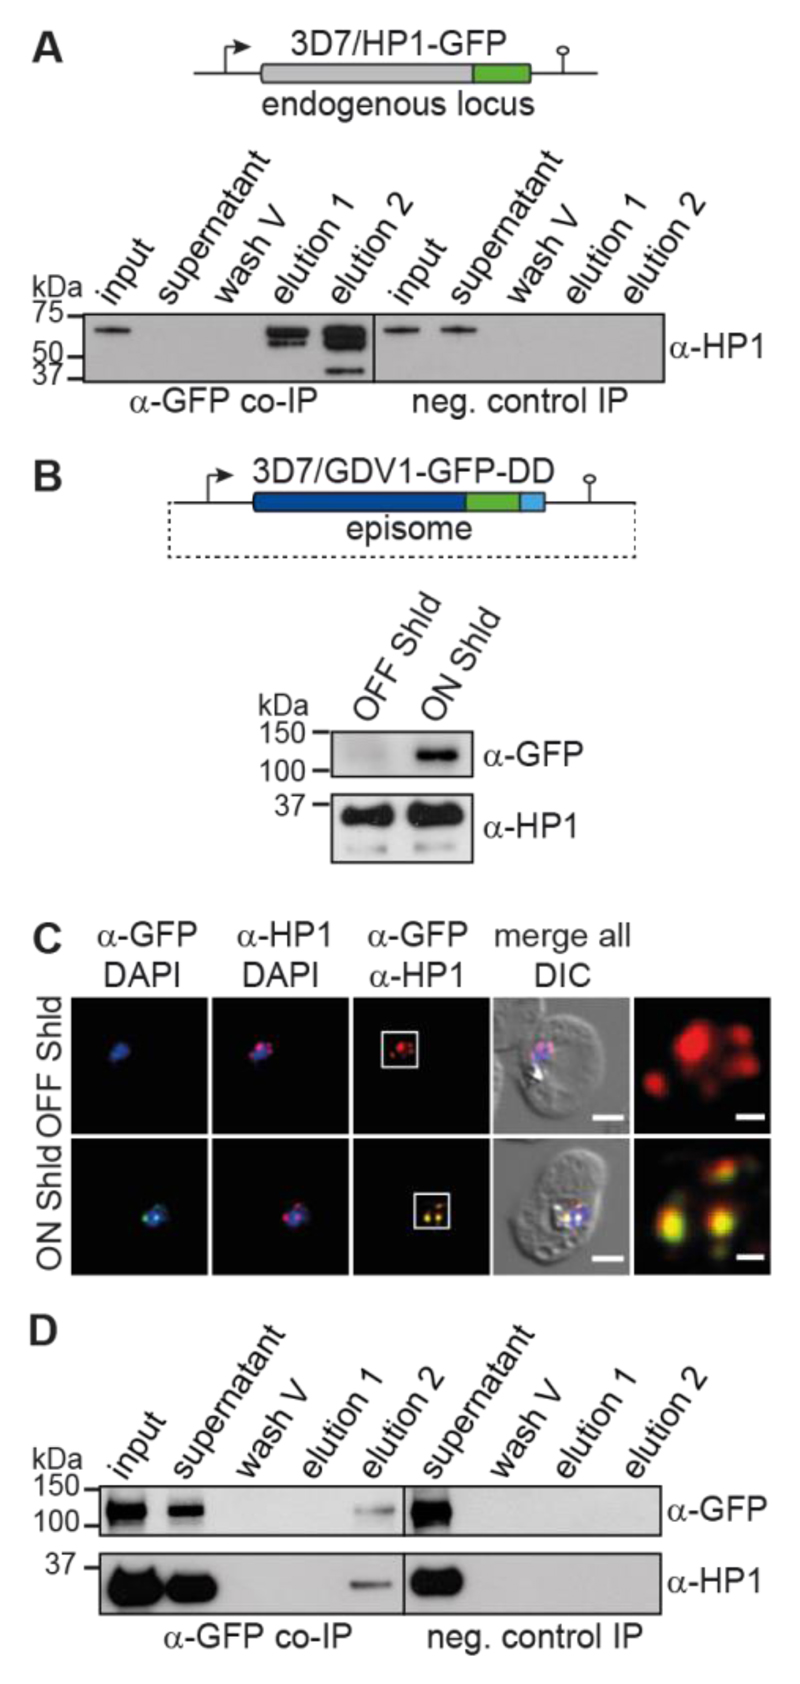
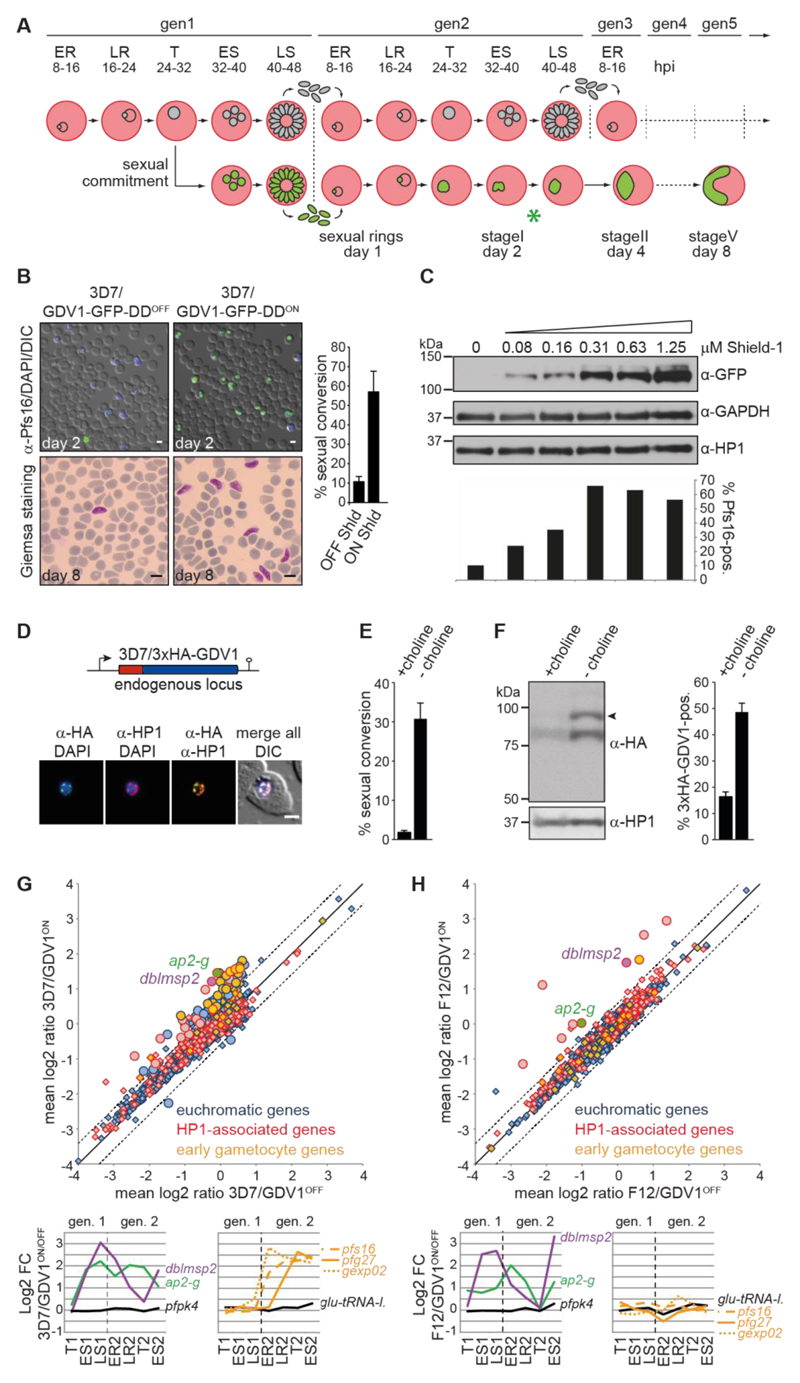
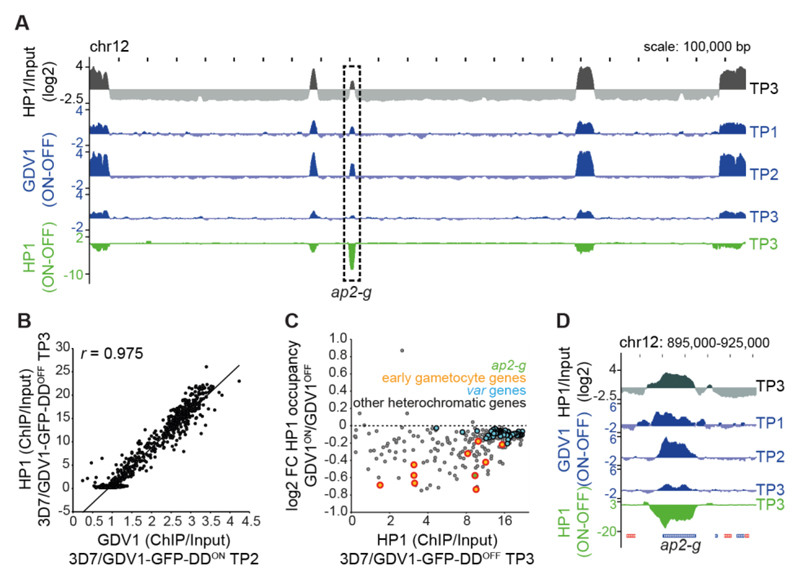
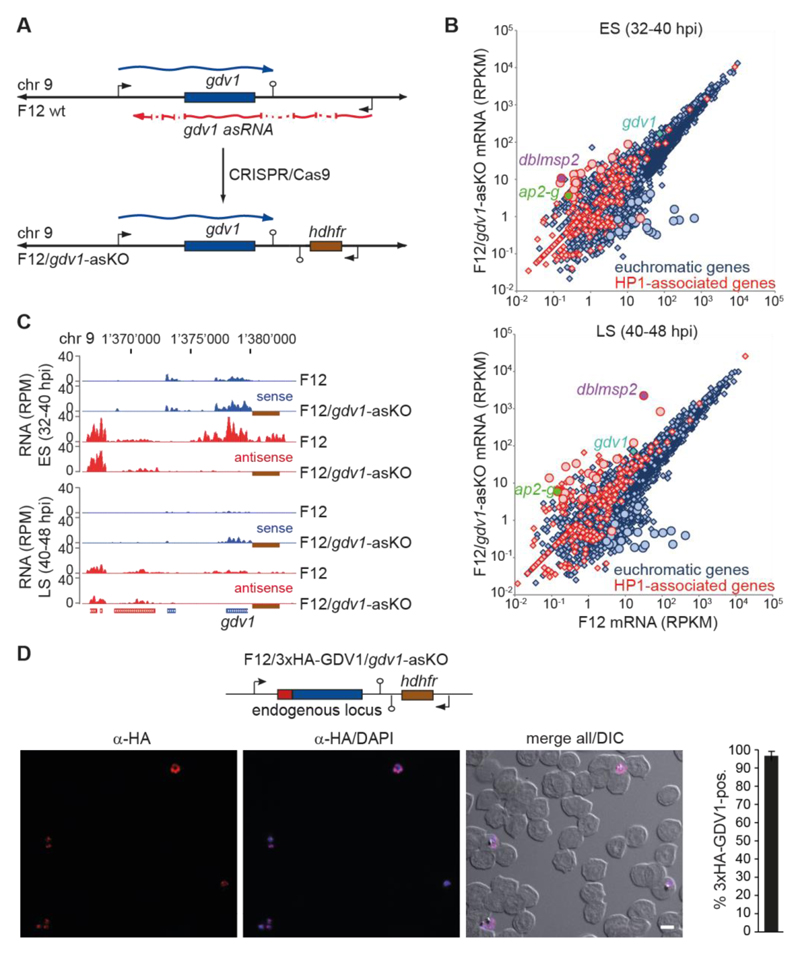
Malaria is caused by Plasmodium parasites that proliferate in the bloodstream. During each replication cycle, some parasites differentiate into gametocytes, the only forms able to infect the mosquito vector and transmit malaria. Sexual commitment is triggered by activation of AP2-G, the master transcriptional regulator of gametocytogenesis. Heterochromatin protein 1 (HP1)-dependent silencing of ap2-g prevents sexual conversion in proliferating parasites. In this study, we identified Plasmodium falciparum gametocyte development 1 (GDV1) as an upstream activator of sexual commitment. We found that GDV1 targeted heterochromatin and triggered HP1 eviction, thus derepressing ap2-g Expression of GDV1 was responsive to environmental triggers of sexual conversion and controlled via a gdv1 antisense RNA. Hence, GDV1 appears to act as an effector protein that induces sexual differentiation by antagonizing HP1-dependent gene silencing.


Figures

Fig. 1
Fig. 1. GDV1 interacts with HP1.
(A) Endogenous hp1 locus in 3D7/HP1-GFP parasites and α-HP1 Western blots of the α-HP1-GFP co-IP and negative control samples. Results are representative of three biological replicates. (B) gdv1-gfp-dd expression plasmid and α-GFP Western blots of 3D7/GDV1-GFP-DDOFF and 3D7/GDV1-GFP-DDON parasites. α-HP1 antibodies served as loading control. (C) GDV1-GFP-DD/HP1 co-localisation IFAs in 3D7/GDV1-GFP-DDOFF and 3D7/GDV1-GFP-DDON trophozoites (24-32 hpi). DIC, differential interference contrast. Scale bar, 2.5 μm (0.5 μm for the magnified views in the rightmost images). Results are representative of three biological replicates. (D) α-GFP and α-HP1 Western blots of the α-GDV1-GFP-DD co-IP and negative control samples. Results are representative of three biological replicates.
Fig. 2
Fig. 2. GDV1 induces sexual commitment and differentiation.
(A) Schematic illustrating the iterative cycles of schizogony and RBC re-invasion (top) or sexual commitment, RBC re-invasion and gametocyte differentiation (bottom). ER/LR, early/late ring stages; T, trophozoites; ES/LS, early/late schizonts; gen, generation; hpi, hours post-invasion; asterisk, time point of α-Pfs16 IFAs. (B) Top panel: α-Pfs16 IFAs identifying stage I gametocytes. Quantification of Pfs16-positive parasites is shown at the right (results are the mean of three biological replicates (200 infected RBCs counted per sample); error bars indicate SD). Bottom panel: Giemsa-stained blood smears showing stage V gametocytes. Scale bars, 5 μm. (C) Western blot showing GDV1-GFP-DD expression in presence of increasing Shield-1 concentrations. α-GAPDH and α-HP1 antibodies served as loading controls. Percentages of Pfs16-positive parasites are shown at the bottom (400 infected RBCs counted per sample). (D) Endogenous gdv1 locus in 3D7/3xHA-GDV1 parasites and 3xHA-GDV1/HP1 co-localisation IFAs in trophozoites (24-32 hpi). Scale bar, 2.5 μm. (E) Sexual conversion rates in 3D7/3xHA-GDV1 parasites cultured in presence or absence of choline (results are the mean of three biological replicates (>190 infected RBCs counted per sample); error bars indicate SD). (F) Left panel: Western blot showing 3xHA-GDV1 expression levels in 3D7/3xHA-GDV1 parasites cultured in presence or absence of choline. α-HP1 antibodies served as loading control. Right panel: Percentages of 3xHA-GDV1-positive parasites in presence or absence of choline (results are the mean of three biological replicates (>100 infected RBCs counted per sample); error bars indicate SD). (G,H) Comparison of mean expression levels of all genes in 3D7/GDV1-GFP-DDON versus 3D7/GDV1-GFP-DDOFF (G) and F12/GDV1-GFP-DDON versus F12/GDV1-GFP-DDOFF parasites (H). Significantly de-regulated genes are indicated by circles (mean fold change cut-off >1.5; q-value (fdr) cut-off <0.15). Known early gametocyte markers (7, 8, 17) are labelled orange. Line graphs show fold changes in expression across seven consecutive TPs. pfs16/pfg27/gexp02, early gametocyte markers (15, 22, 32); pk4 (PF3D7_0628200)/glu-tRNA-l. (PF3D7_1331700), control genes (7).
Fig. 3
Fig. 3. GDV1 associates with heterochromatin throughout the genome and triggers HP1 removal at ap2-g.
(A) HP1 over input ratio track from 3D7/GDV1-GFP-DDOFF schizonts (38-44 hpi, TP3) (grey). ChIP-seq subtraction tracks display relative enrichment of GDV1-GFP-DD in 3D7/GDV1-GFP-DDON schizonts two (30-36 hpi, TP1), six (34-40 hpi, TP2) and ten (38-44 hpi, TP3) hours after Shield-1 addition (blue), and relative depletion of HP1 in 3D7/GDV1-GFP-DDON parasites at TP3 (green). (B) Correlation between GDV1-DD-GFP enrichment in 3D7/GDV1-GFP-DDON (34-40 hpi, TP2) and HP1 enrichment in 3D7/GDV1-GFP-DDOFF schizonts at each coding region. r, Pearson correlation coefficient. (C) Fold change in HP1 enrichment upon GDV1-GFP-DD overexpression in relation to HP1 enrichment in 3D7/GDV1-GFP-DDOFF schizonts for each heterochromatic gene. (D) Zoom-in view of the enrichment/subtraction tracks at the ap2-g locus.
Fig. 4
Fig. 4. A gdv1 antisense RNA antagonises GDV1-dependent sexual commitment.
(A) gdv1 locus in F12 wild-type and F12/gdv1-asKO parasites. The gdv1 sense transcript (blue), five-exon gdv1-asRNA (24) (red) and hdhfr resistance marker (brown) are highlighted. (B) Comparison of gene expression levels in F12 wild-type and F12/gdv1-asKO early (ES) and late (LS) schizonts. Genes de-regulated > 5-fold in both TPs are indicated by circles. (C) UCSC genome browser screenshots of RNA-seq coverage plots over the gdv1 locus in F12 wild-type and F12/gdv1-asKO early (ES) and late (LS) schizonts. The hdhfr resistance cassette downstream of the gdv1 locus in F12/gdv1-asKO parasites and absent in the 3D7 reference genome is indicated by a brown box. (D) Endogenous gdv1 locus in F12/3xHA-GDV1/gdv1-asKO parasites and α-HA overview IFA in early schizonts (ES, 32-40 hpi). DIC, differential interference contrast. Scale bar, 5 μm. Percentage of 3xHA-GDV1-positive parasites is shown at the right (results are the mean of three biological replicates (100 infected RBCs counted per sample); error bars indicate SD).

Comment in

References

    1. Kwon SH, Workman JL. The heterochromatin protein 1 (HP1) family: put away a bias toward HP1. Mol Cells. 2008;26:217–227. - PubMed
    1. Flueck C, et al. Plasmodium falciparum heterochromatin protein 1 marks genomic loci linked to phenotypic variation of exported virulence factors. PLoS Pathog. 2009;5:e1000569. - PMC - PubMed
    1. Rovira-Graells N, et al. Transcriptional variation in the malaria parasite Plasmodium falciparum. Genome Res. 2012;22:925–938. - PMC - PubMed
    1. Voss TS, Bozdech Z, Bartfai R. Epigenetic memory takes center stage in the survival strategy of malaria parasites. Curr Opin Microbiol. 2014;20:88–95. - PubMed
    1. Kafsack BF, et al. A transcriptional switch underlies commitment to sexual development in malaria parasites. Nature. 2014;507:248–252. - PMC - PubMed

Publication types

MeSH terms

Substances