. 2018 Apr 5;556(7699):64-69.
doi: 10.1038/nature26158. Epub 2018 Mar 28.

Architecture of the human GATOR1 and GATOR1-Rag GTPases complexes

Affiliations

Architecture of the human GATOR1 and GATOR1-Rag GTPases complexes

Kuang Shen et al. Nature. .

Abstract

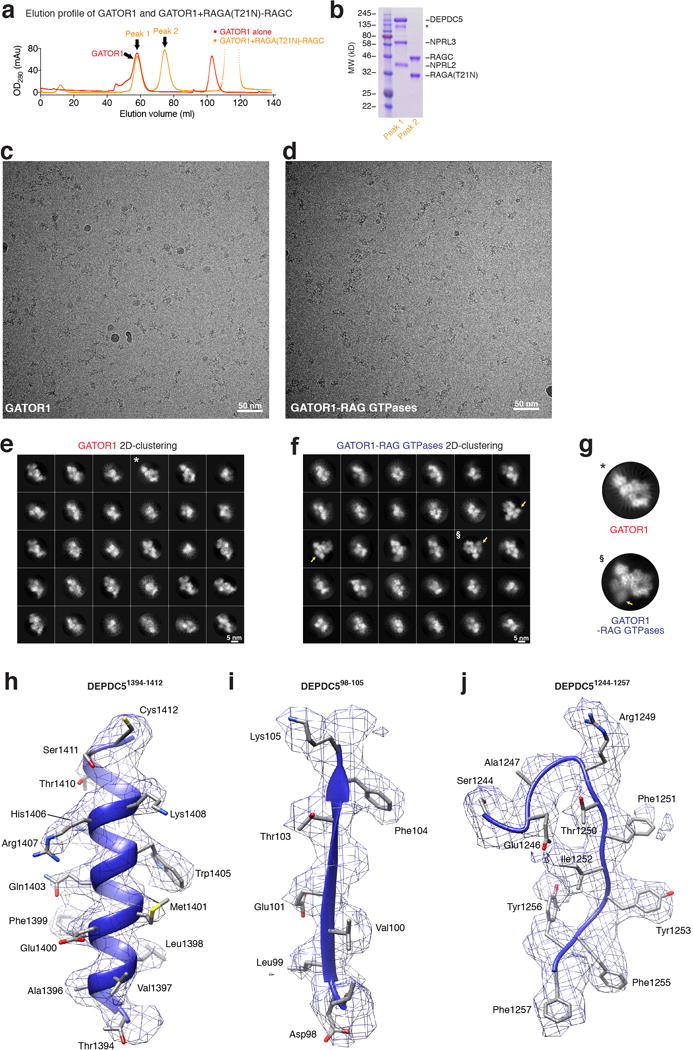
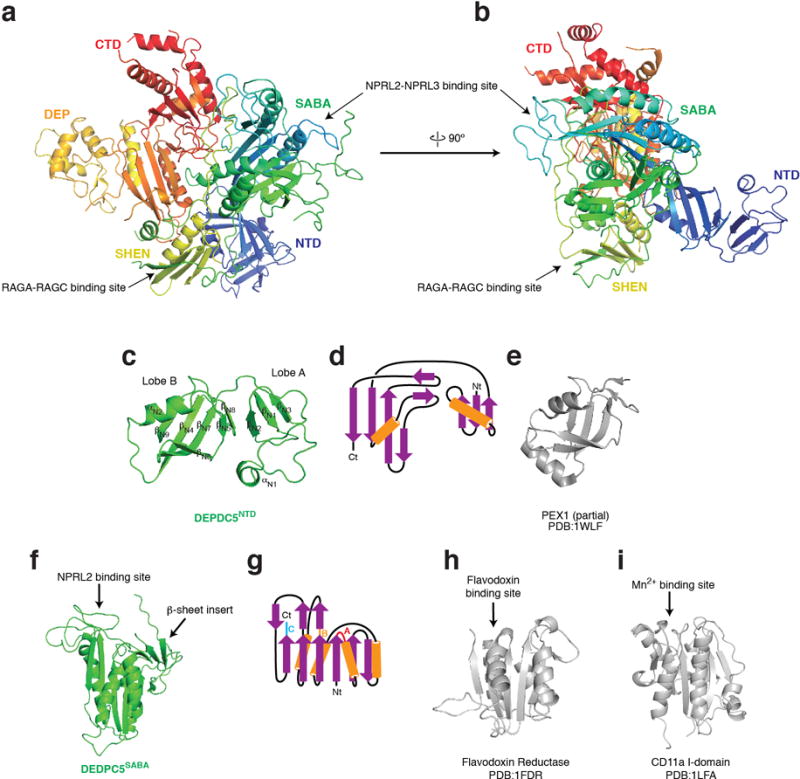
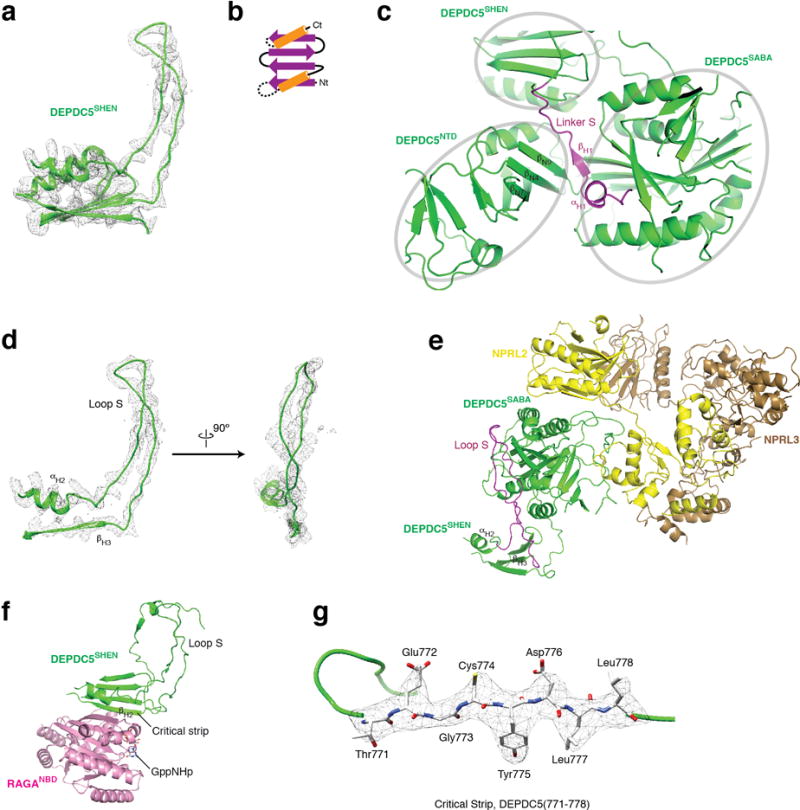
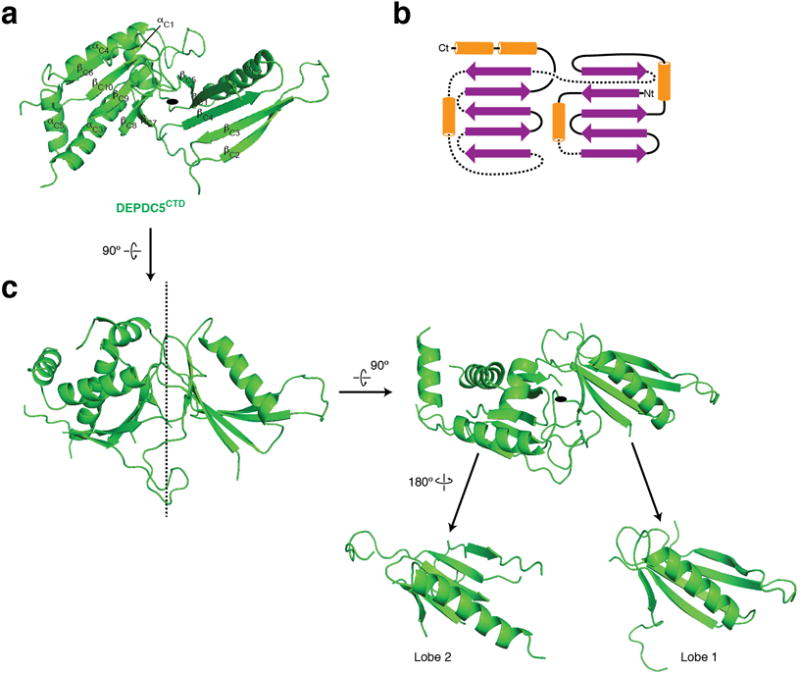
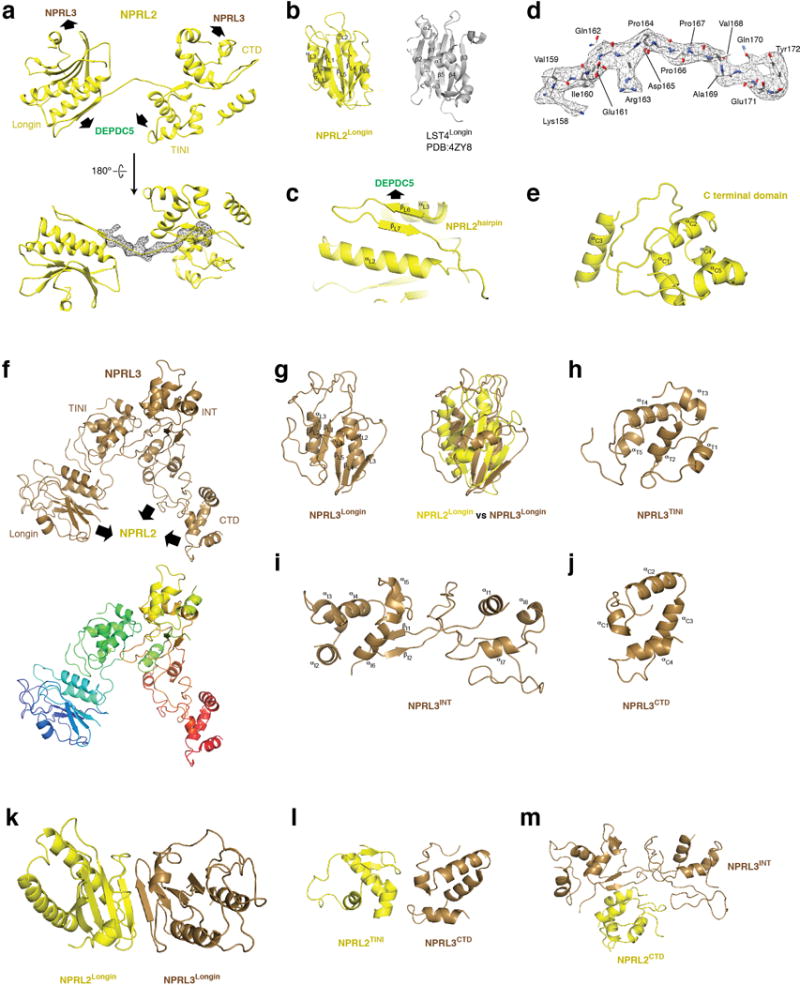
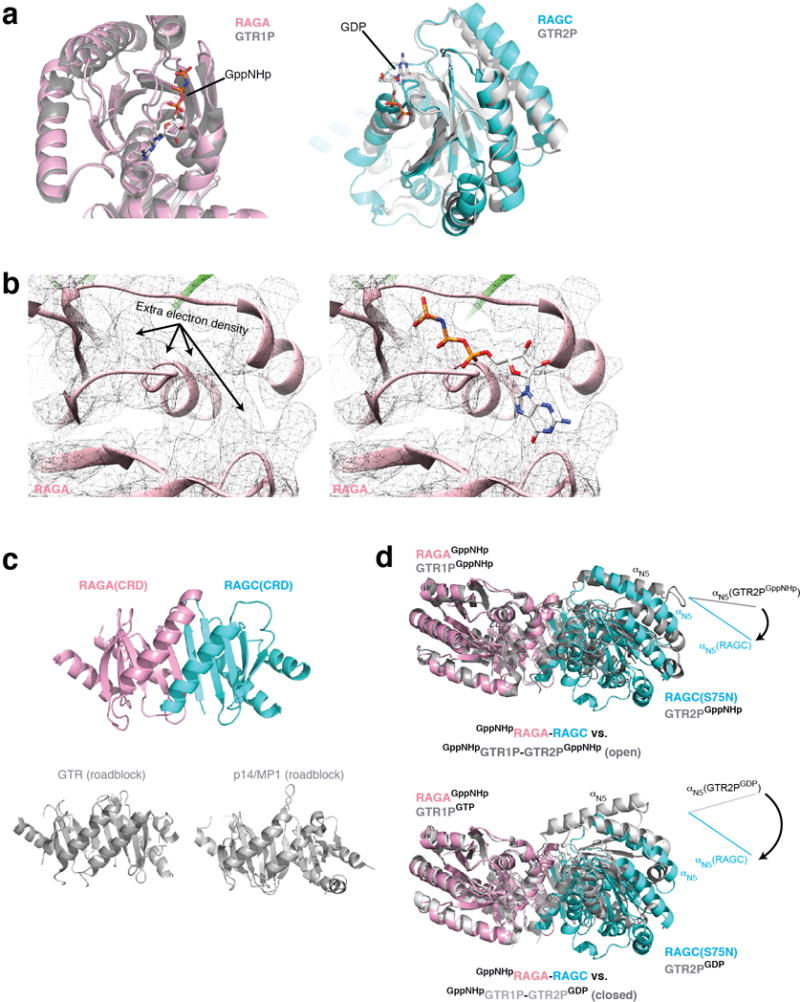
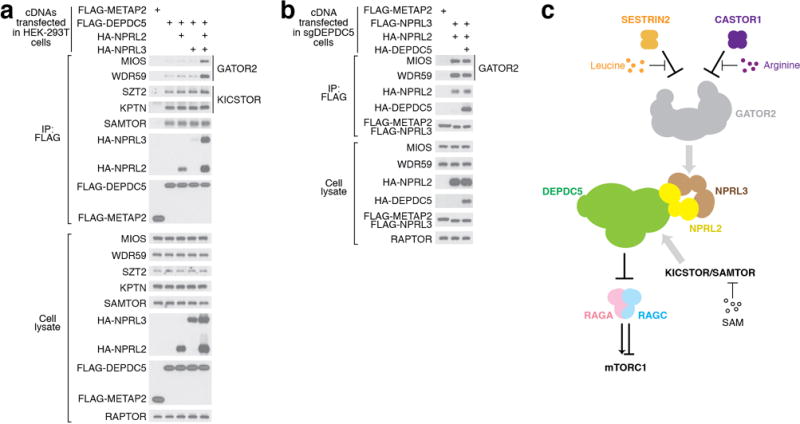
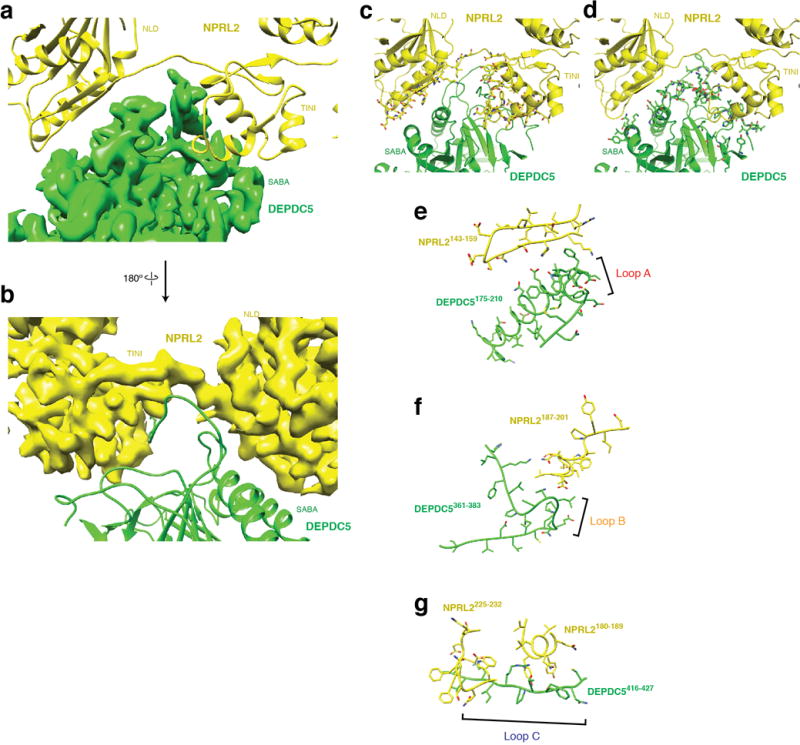
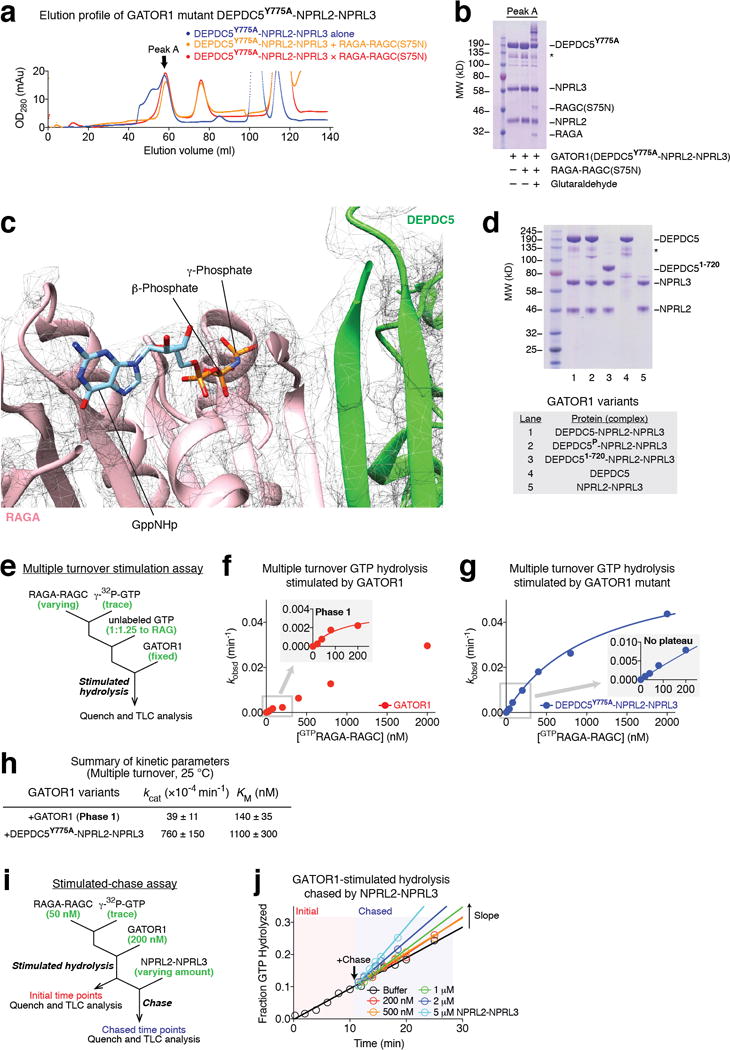
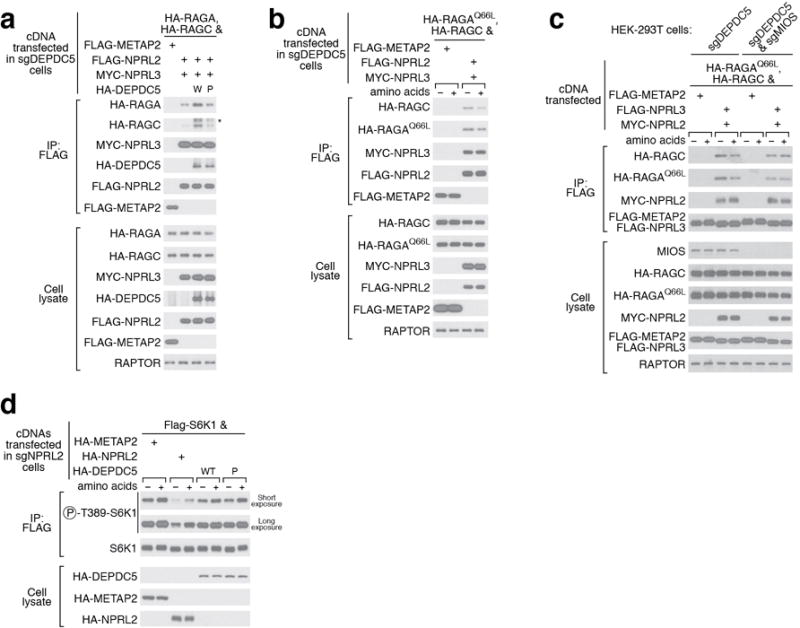
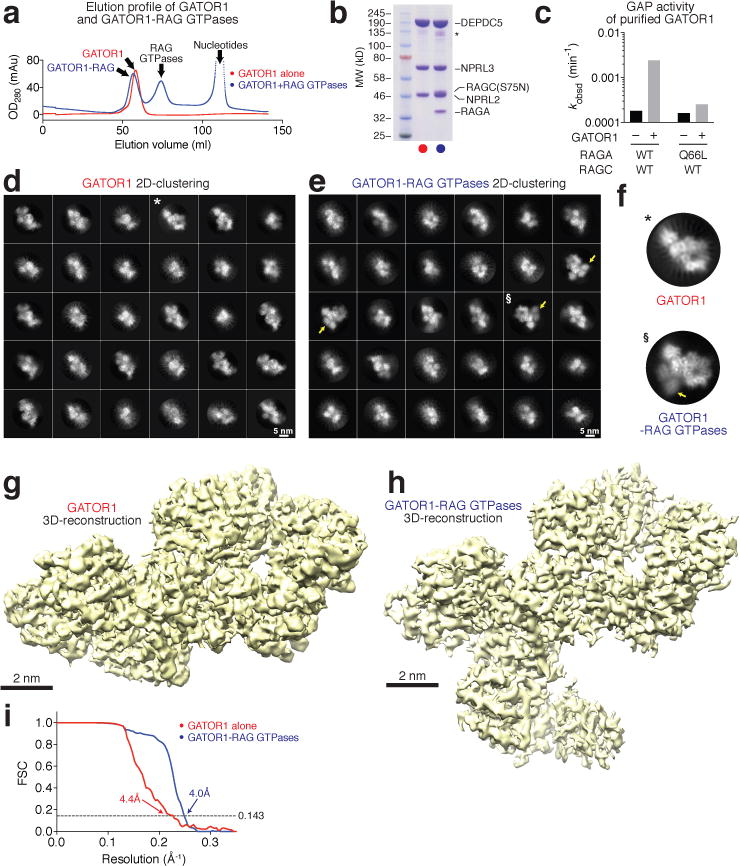
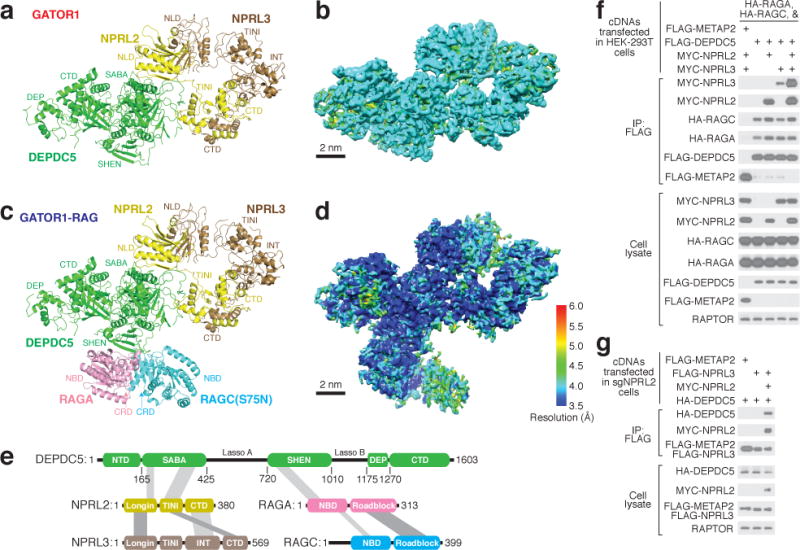
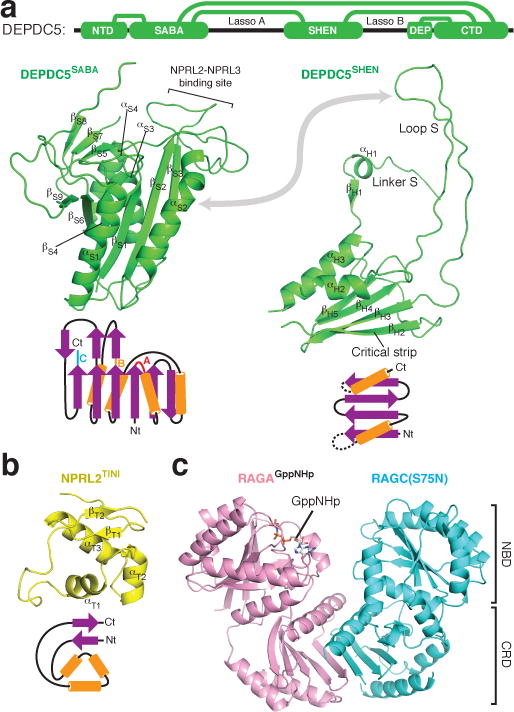
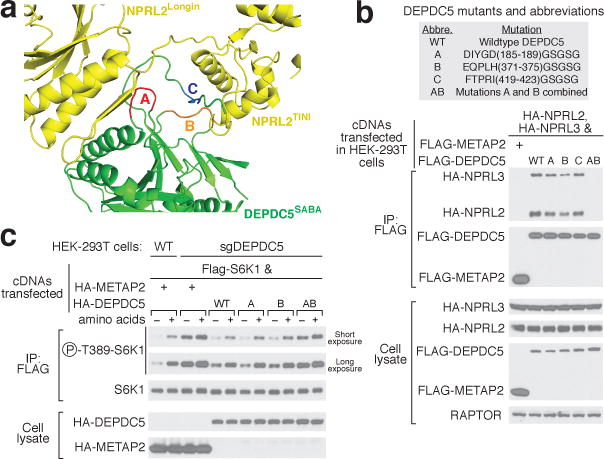
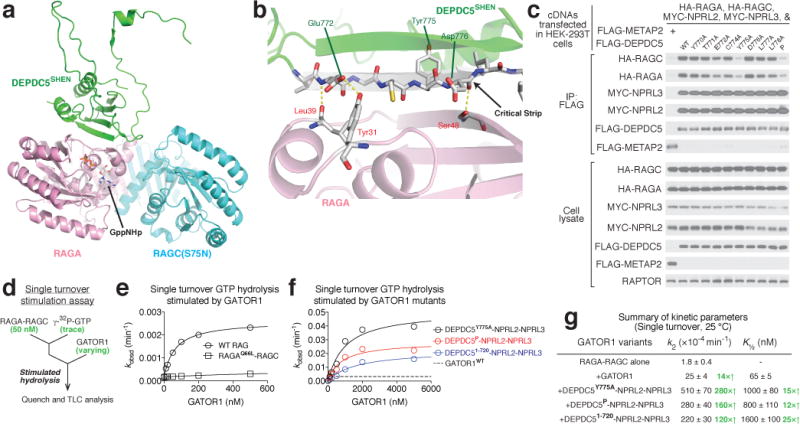
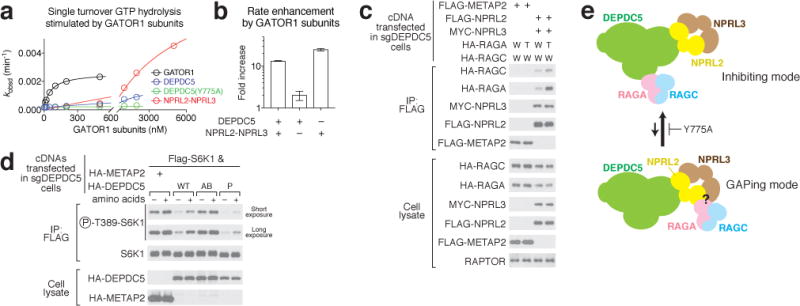
Nutrients, such as amino acids and glucose, signal through the Rag GTPases to activate mTORC1. The GATOR1 protein complex-comprising DEPDC5, NPRL2 and NPRL3-regulates the Rag GTPases as a GTPase-activating protein (GAP) for RAGA; loss of GATOR1 desensitizes mTORC1 signalling to nutrient starvation. GATOR1 components have no sequence homology to other proteins, so the function of GATOR1 at the molecular level is currently unknown. Here we used cryo-electron microscopy to solve structures of GATOR1 and GATOR1-Rag GTPases complexes. GATOR1 adopts an extended architecture with a cavity in the middle; NPRL2 links DEPDC5 and NPRL3, and DEPDC5 contacts the Rag GTPase heterodimer. Biochemical analyses reveal that our GATOR1-Rag GTPases structure is inhibitory, and that at least two binding modes must exist between the Rag GTPases and GATOR1. Direct interaction of DEPDC5 with RAGA inhibits GATOR1-mediated stimulation of GTP hydrolysis by RAGA, whereas weaker interactions between the NPRL2-NPRL3 heterodimer and RAGA execute GAP activity. These data reveal the structure of a component of the nutrient-sensing mTORC1 pathway and a non-canonical interaction between a GAP and its substrate GTPase.


Conflict of interest statement

The authors declare no competing financial interests.

Figures

Extended Data Figure 1
a. Gel filtration profiles for GATOR1 (red line) and GATOR1 + RagA(T21 N)-RagC (orange line). The peak position for GATOR1 does not shift upon incubation with RagA(T21N)-RagC, suggesting no direct binding between the two complexes. b. Coomassie blue stained SDS-PAGE analysis of the two peaks on GATOR1 + RagA(T21N)-RagC elution profile. No co-elution is observed. Asterisk denotes a non-specific band that copurifies with GATOR1. c & d. Raw cryo-EM images for GATOR1 (c) and the GATOR1-Rag complex (d). Discrete particles were clearly visualized under the microscope. The scale bars represent 50 nm. e & f. Two-dimensional clustering of GATOR1 (e) and GATOR1-Rag GTPases (f). Yellow arrows in f point to the extra EM densities in comparison to e. * and § mark the particles to be shown in g. Scale bars represent 5 nm. g. Direct comparison of particles from two-dimensional clustering of GATOR1 and GATOR1-Rag GTPases. Extra EM densities for the Rag GTPases can be directly observed. h-j. Sample EM density maps and the fitted structures for α-helical (h), β-strand (i), and loop (j) region of Depdc5. Secondary structures and bulky side chains can be unambiguously resolved at the current resolution. Data (a & b) are the representatives of two independent experiments.
Extended Data Figure 2
Architecture of Depdc5, the largest subunit of GATOR1. a & b Two views of Depdc5. The protein backbone is depicted in rainbow colors from the N- (blue) to C- (red) termini. Binding sites for Nprl2-Nprl3 and the Rag GTPases are marked. c & d. Structural model (c) and topological diagram (d) for Depdc5-NTD. e. Lobe B of Depdc5-NTD shares structural similarity to the N-terminal domain of the PEX1 AAA-ATPase. f-i. The SABA domain of Depdc5 (f) shares topological similarity (g) to flavodoxin reductase (h) and CD11a I domain (i), which all contain ligand binding sites as pointed out by the arrows. The SABA domain contains a β-sheet insertion formed by three strands. The three loops in the SABA domain of Depdc5 that mediate the Depdc5-Nprl2 interaction are colored red (loop A), orange (loop B), and blue (loop C), respectively, on the topological diagram. Nt: N-terminus. Ct: C-terminus.
Extended Data Figure 3
Architecture of the SHEN domain of Depdc5. a. EM density map and structural model for the SHEN domain. b. Topological diagram for the SHEN domain. c. βH1 on Linker S forms a continuous sheet with the β-strands on Lobe B of NTD, and positions itself between NTD and the SABA domain. d. EM density map and structural model for Loop S. e. Loop S (shown in purple) mediates interdomain contact with the SABA domain of Depdc5, close to where Nprl2-Nprl3 dimer binds. f. βH2 of the SHEN domain directly contacts RagA (shown in pink), which we named as the critical strip. g. EM density map and the atomic model for the critical strip. Bulky residues can be unambiguously registered into the EM density.
Extended Data Figure 4
Architecture of the C-terminal domain (CTD) of Depdc5. a and b. Structure (a) and topological diagram (b) for Depdc5-CTD. c. Depdc5-CTD shows a pseudo two-fold rotational symmetry. Two lobes with similar folds can be seen.
Extended Data Figure 5
Architecture of Nprl2 and Nprl3. a. Structural model for Nprl2. Contact surfaces with Depdc5 and Nprl3 are pointed out by arrows. A long linker connects the Longin domain and the TINI domain with EM density shown in mesh. The atomic model for this linker is shown in d. b. Longin domain of Nprl2. A standard Longin domain from LST4 is shown for comparison. c. A strand-turn-strand motif (hairpin) is attached to the Longin domain of Nprl2, which mediates partial interaction with Depdc5. d. EM density map and atomic model for the linker connecting the Longin domain and the TINI domain (cf. the EM density in a). e. Structural model for the C-terminal domain (CTD) of Nprl2. f. Structural model for Nprl3. Contact surfaces with Nprl2 are indicated with arrows. g. Longin domain of Nprl3 and its overlap with the Longin domain of Nprl2. h. Structural model for the TINI domain of Nprl3 which connects its Longin domain with the C-terminal domains. i. Structural model for the Intermediary (INT) domain of Nprl3. j. Structural model for the C-terminal domain (CTD) of Nprl3. k-m. Interactions between Nprl2 and Nprl3. Three contact surfaces were identified that mediate the interactions between Nprl2 and Nprl3: the Longin domains of Nprl2 and Nprl3 (k), the TINI domain of Nprl2 and CTD of Nprl3 (I), and the CTD of Nprl2 and the INT domain of Nprl3 (m).
Extended Data Figure 6
Architecture of the Rag GTPase heterodimer. a. Nucleotide binding domains (NBD) of RagA (pink) and RagC (cyan) overlap with those of Gtr1p and Gtr2p (grey). b Extra EM density can be observed in the nucleotide binding pocket of RagA, where GppNHp can be fitted. c. The C-terminal Roadblock domains (CRD) of RagA and RagC tightly dimerize with one another. For comparison, the dimerized Roadblock domains from Gtr1p-Gtr2p and p14-MP1 are shown. d. Global conformation of the Rag GTPase heterodimer in comparison to the two crystal structures of Gtr1p-Gtr2p. RagA and Gtr1p are aligned. Rotational movement of RagC-NBD is illustrated and compared with Gtr2p-NBD by the direction of αN5. The NBDs of the Rag GTPases rotate further away from one another even compared with the open conformation of Gtr1p-Gtr2p (top).
Extended Data Figure 7
GATOR1 orchestrates amino acid signaling on the lysosomal surface. a. Co-immunoprecipitation of GATOR2, KICSTOR, and SAMTOR components by overexpressed GATOR1 in HEK-293T cells. Depdc5 by itself is sufficient to pull down endogenous KICSTOR components and SAMTOR. Nprl3 is necessary to pull down GATOR2 components. b. Co-immunoprecipitation of endogenous GATOR2 components by overexpressed Nprl2-Nprl3 in cells lacking Depdc5. Nprl2-Nprl3 dimer is sufficient to pull down GATOR2, while additional Depdc5 causes no further effect. c. Amino acid and metabolites signals are transmitted to GATOR1 through various routes. Data (a & b) are the representatives of two independent experiments.
Extended Data Figure 8
Interactions between Depdc5 and Nprl2. a & b. Large contact surfaces between Depdc5 (green) and Nprl2 (yellow) are observed from the EM density map and structural models. c & d. Surface residues on Nprl2 (c) and Depdc5 (d) participating in mediating the interactions, identified by “InterfaceResidue” script in Pymol. e-g. Loops A (e), B (f), and C (g) on Depdc5 directly contact Nprl2.
Extended Data Figure 9
In vitro characterization of the GAP mechanism of GATOR1. a. Gel filtration profiles for Depdc5(Y775A)-Nprl2-Nprl3 (blue line) and Depdc5(Y775A)-Nprl2-Nprl3 + RagA-RagC(S75N) in the absence (orange line) or presence (red line) of glutaraldehyde, a crosslinker. Peak A denotes the species eluted at the large molecular weight region. b. Coomassie blue stained SDS-PAGE analysis of Peak A. Direct binding is only observed in the presence of glutaraldehyde. Asterisk denotes a non-specific band that co-purifies with GATOR1. c. No extra EM density can be observed near the NBD of RagA. d. GATOR1 variants visualized by SDS-PAGE followed by Coomassie blue staining. Asterisk denotes a non-specific band that co-purifies with GATOR1. e. Scheme for measuring stimulated GTP hydrolysis by GATOR1 in a multiple turnover setup. Excess amount of singly-GTP loaded Rag GTPases was incubated with fixed amount of GATOR1. The hydrolysis reaction was traced and quantified. f. Stimulated GTP hydrolysis by wildtype GATOR1 shows a biphasic behavior in reaction kinetics. As increasing amount of the Rag GTPases was included in the reaction, a small plateau of observed rate constant (kobsd) was first observed at a lower concentration (inset). Such biphasic behavior indicates that two binding modes exist in the wildtype GATOR1: one with higher affinity to the Rag GTPases but lower GAP activity, the other with lower affinity but higher GAP activity. A representative data set is shown in this panel, and the statistics are summarized below. g. Stimulated GTP hydrolysis by GATOR1 mutant that is defective in Rag binding eliminates the initial phase. Depdc5(Y775A)-Nprl2-Nprl3 is defective in stable Rag binding because it lacks the docking site (an intact critical strip) for the Rag GTPases. Consequentially, the inhibitory mode diminishes (inset), leaving a single phase corresponding to the GAPing mode in reaction kinetics. A representative data set is shown in this panel, and the statistics are summarized below. h. Summary of kinetic parameters for the multiple turnover GAP activity shown in panels f and g. Mean±STD of two to three independent experiments was reported. i. A stimulated-chase assay to characterize the inhibition mechanism of Depdc5. Wildtype GATOR1 was first added to bind the Rag GTPases with its inhibitory mode. Extra Nprl2-Nprl3 was then included in the reaction as a chase. We reason that if Depdc5 sequesters RagA-NBD, no further stimulation should be observed; if Depdc5 simply prevents Nprl2-Nprl3 from accessing RagA-NBD, we should observe additional stimulation because there is no Depdc5 to inhibit the extra Nprl2-Nprl3. j. Further stimulation is observed in the presence of additional Nprl2-Nprl3, as reflected by the faster hydrolysis rate (steeper slope), suggesting Depdc5 inhibits Nprl2-Nprl3 in cis. Data (a, b, d, & j) are the representatives of two independent experiments.
Extended Data Figure 10
In vivo characterization of the GAP mechanism of GATOR1. a. Interaction between Nprl2-Nprl3 and the Rag GTPases is enhanced by wildtype Depdc5, but not mutant P which is defective in binding to the Rag GTPases. W: Wildtype Depdc5; P: mutant P. Asterisk denotes a non-specific band. b. Amino acid availability regulates the interaction between Nprl2-Nprl3 and the Rag GTPases in cells lacking Depdc5. Higher amount of Rag GTPases co-immunoprecipitates with Nprl2-Nprl3 in the absence of amino acids. c. Loss of regulated interaction between Nprl2-Nprl3 and the Rag GTPases in cells lacking Depdc5 and Mios. No difference is observed when GATOR2, the receptor for amino acid signals, is knocked out. d. Expression of Dedpc5 mutant that is defective in Rag GTPase binding has no effect in Nprl2-null cells, which sharply contrasts the result in Fig. 6e. Data (a-d) are the representatives of two independent experiments.
Figure 1
Figure 1. Structural determination of GATOR1 and the GATOR1-Rag complex
a. Gel filtration profiles for GATOR1 (red line) and GATOR1-Rag GTPases (blue line). b. Coomassie blue stained SDS-PAGE analysis of purified GATOR1 (red) and GATOR1-Rag GTPases (blue). c. In vitro GAP activity of purified GATOR1. d & e. Envelopes of GATOR1 (d) and GATOR1-Rag GTPases (e) from the three-dimensional reconstructions with density shown at 0.05 threshold level (UCSF Chimera). Scale bars represent 2 nm. f. Gold-standard Fourier shell correlation (FCS) for GATOR1 (red line) and the GATOR1-Rag GTPases (blue line). Data (a-c) are the representatives of two independent experiments. See Supplementary Table 1 for cryo-EM data collection and refinement.
Figure 2
Figure 2. Architectures of GATOR1 and of the GATOR1-Rag GTPases complex
a & c. Atomic models and domain assignment for GATOR1 (a) and the GATOR1-Rag GTPases complex (c). b & d. Local resolution of GATOR1 (b) and the GATOR1-Rag GTPases complex (d). e. Domain organization and interaction map for the GATOR1-Rag GTPases complex. Grey bars indicate domain-domain interactions. f & g. Co-immunoprecipitation assay to validate interactions amongst subunits of the GATOR1-Rag GTPases complex in wildtype HEK293T (f) and sgNPRL2 cells (g). Data (f & g) are the representatives of two independent experiments. For gel source data here and below, see Supplementary Figure 1. See Supplementary Table 1 for model building and validation.
Figure 3
Figure 3. Domain structures within the GATOR1-Rag GTPases complex
a. Structures and topological diagrams for the SABA and SHEN domains of Depdc5. Interdomain contacts are illustrated with green lines. b. Structure and topological diagram for the TINI domain of Nprl2. Nt: N-terminus. Ct: C-terminus. c. Structure of the RagA-RagC(S75N) heterodimer. NBD: Nucleotide binding domain. CRD: C-terminal roadblock domain.
Figure 4
Figure 4. An intact GATOR1 is necessary for mTORC1 inhibition upon amino acid starvation
a. Three loops in the SABA domain of Depdc5 mediate the Depdc5-Nprl2 interaction. Loops A, B, and C are colored in red, orange, and blue, respectively. b. Compound mutant of loop A and loop B in Depdc5 disrupts GATOR1 assembly. c. Expression of Dedpc5 mutant that prevents GATOR1 assembly does not restore normal mTORC1 signaling in cells lacking Depdc5. Data (b & c) are the representatives of two independent experiments.
Figure 5
Figure 5. The Depdc5-Rag interaction represents an inhibitory state for GATOR1
a. Architecture of the SHEN domain-Rag GTPases interaction. b. The critical strip on Depdc5 mediates the interaction with RagA. Three pairs of hydrogen bonds are shown in yellow dashed line. c. Point mutations in the critical strip of Depdc5 impair binding of the Rag GTPase heterodimer to GATOR1. d. Scheme for single turnover GTP hydrolysis assay to determine the stimulatory effect of GATOR1 on the Rag GTPases. e & f. Dose-dependent GAP activity of wildtype GATOR1 (e) and variants that are defective in Rag GTPase binding (f). Representative data sets are shown here, and the statistics are summarized in g. g. Summary of kinetic parameters for the GAP activity shown in panels e and f. Mean±STD of two to three independent experiments was reported.
Figure 6
Figure 6. A two-state model of the GATOR1 function
a & b. Dose-dependent GAP activity of GATOR1 subunits Depdc5 and Nprl2-Nprl3 (a) and quantification (b). A representative data set is shown in a, and the statistics are summarized in b. Mean±STD of three independent experiments was shown. c. Interaction between Nprl2-Nprl3 and the Rag GTPases in the absence of Depdc5. W: Wildtype RagA or RagC; T: RagA(Q66L) mutant. d. A two-state model showing the equilibrium between GATOR1 and the Rag GTPases. Both the inhibitory mode and the GAPing mode are required for regulating mTORC1 activity. e. Expression of Dedpc5 mutant that is defective in Rag GTPase binding further suppresses mTORC1 activity in Depdc5-null cells. Data (c & e) are the representatives of two independent experiments.

References

    1. Efeyan A, Comb WC, Sabatini DM. Nutrient-sensing mechanisms and pathways. Nature. 2015;517:302–310. - PMC - PubMed
    1. Shaw RJ, Cantley LC. Ras, PI(3)K and mTOR signalling controls tumour cell growth. Nature. 2006;441:424–430. - PubMed
    1. Jewell JL, Russell RC, Guan KL. Amino acid signalling upstream of mTOR. Nat Rev Mol Cell Biol. 2013;14:133–139. - PMC - PubMed
    1. Gonzalez A, Hall MN. Nutrient sensing and TOR signaling in yeast and mammals. EMBO J. 2017;36:397–408. - PMC - PubMed
    1. Saxton RA, Sabatini DM. mTOR Signaling in Growth, Metabolism, and Disease. Cell. 2017;168:960–976. - PMC - PubMed

Publication types

MeSH terms