. 2018 Apr 5;556(7699):113-117.
doi: 10.1038/nature25986. Epub 2018 Mar 28.

Itaconate is an anti-inflammatory metabolite that activates Nrf2 via alkylation of KEAP1

Affiliations

Itaconate is an anti-inflammatory metabolite that activates Nrf2 via alkylation of KEAP1

Evanna L Mills et al. Nature. .

Abstract

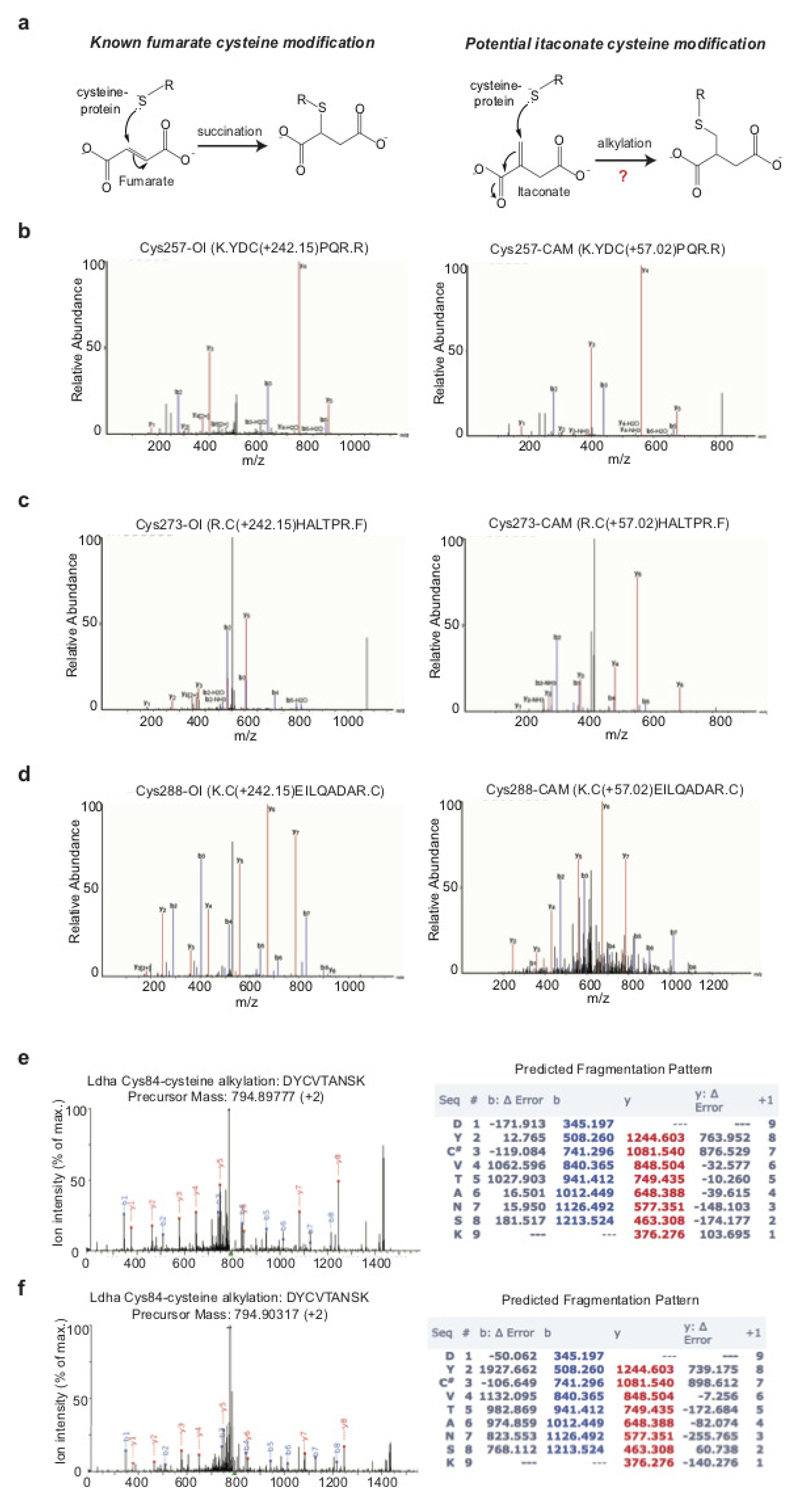
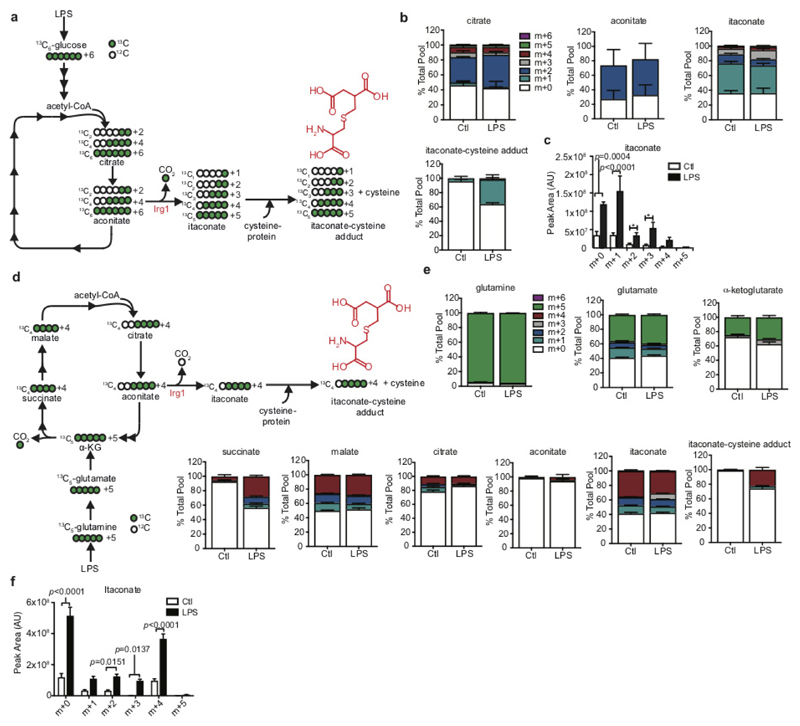
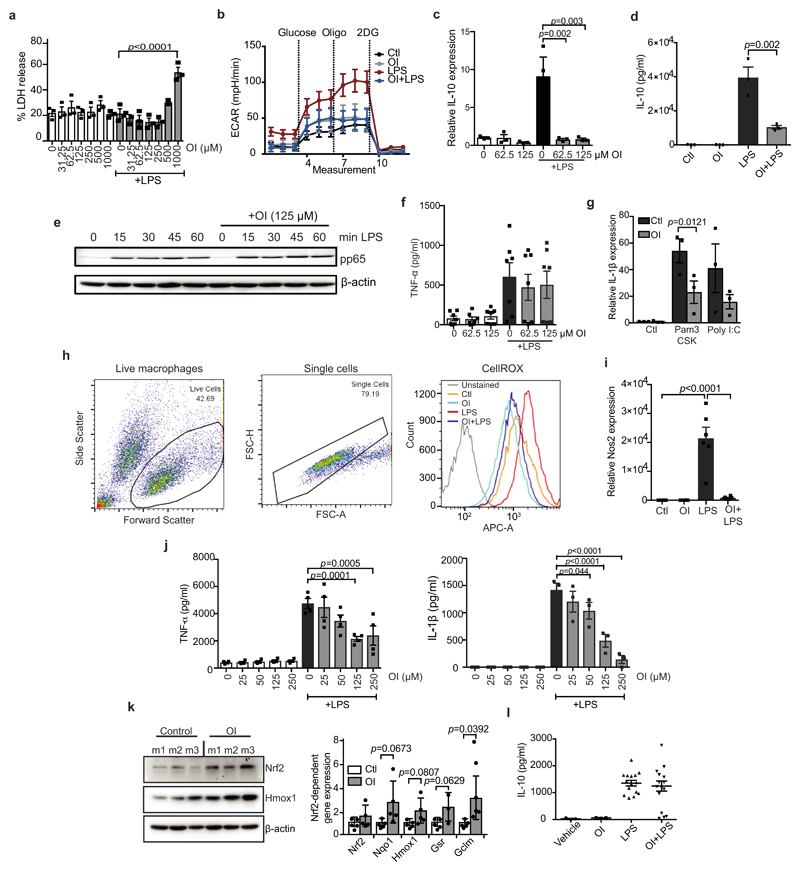
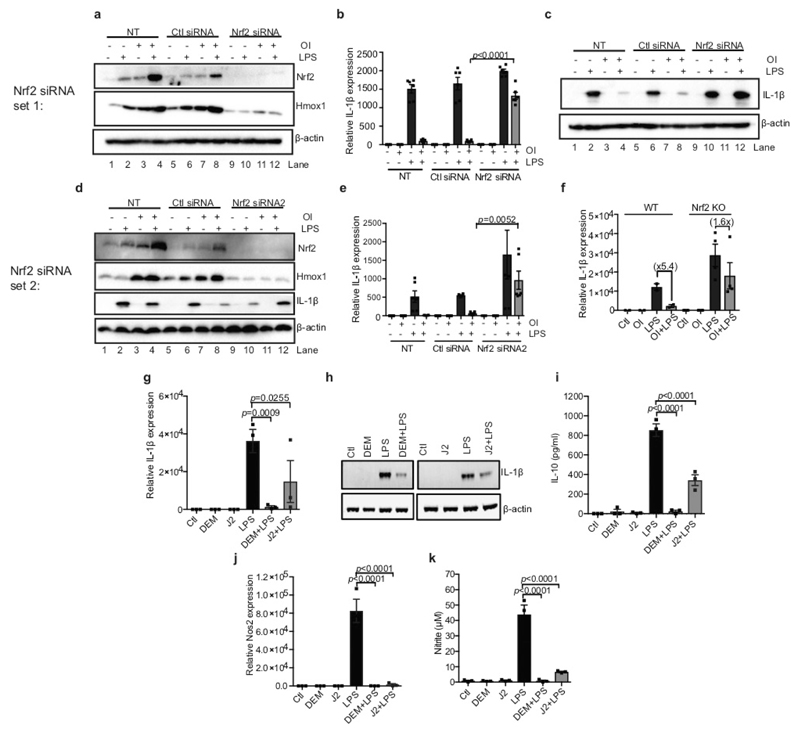
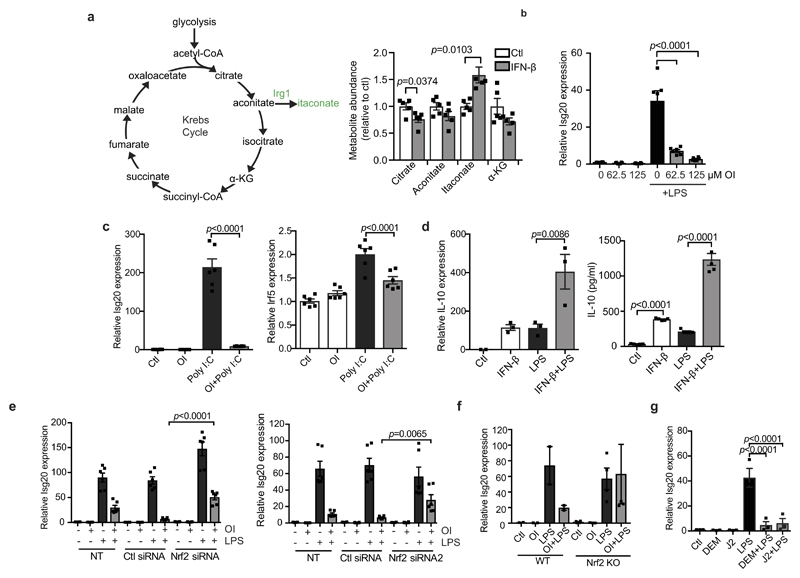
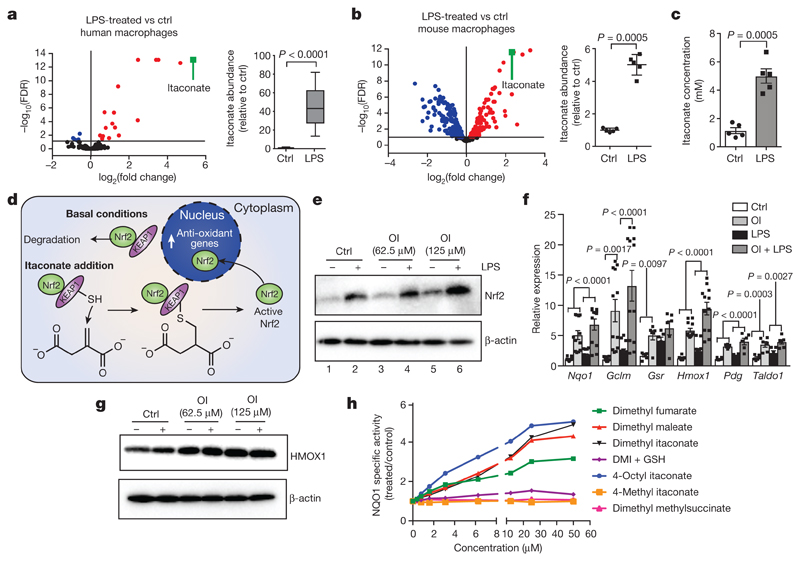
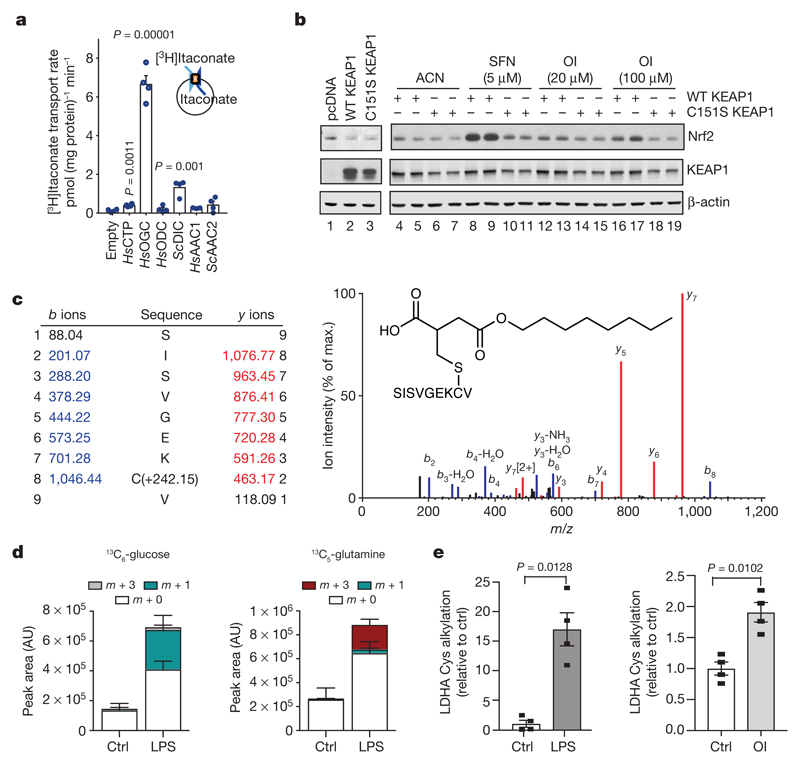
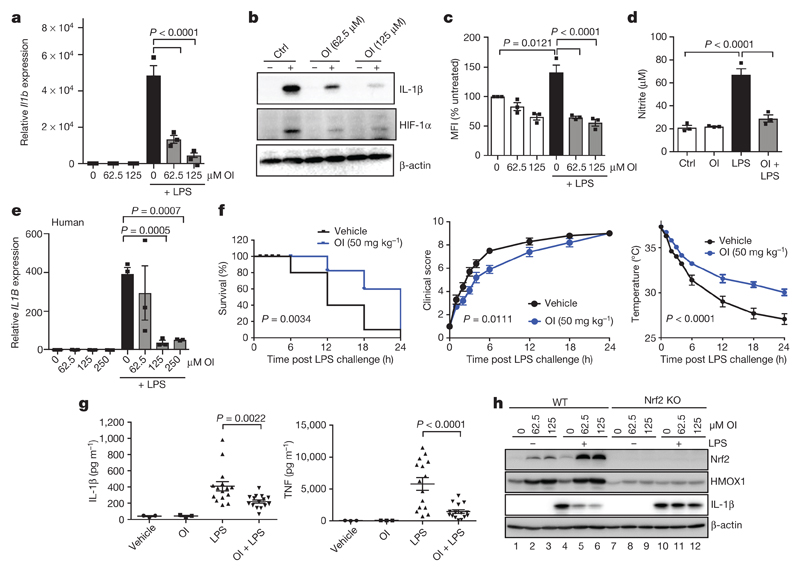
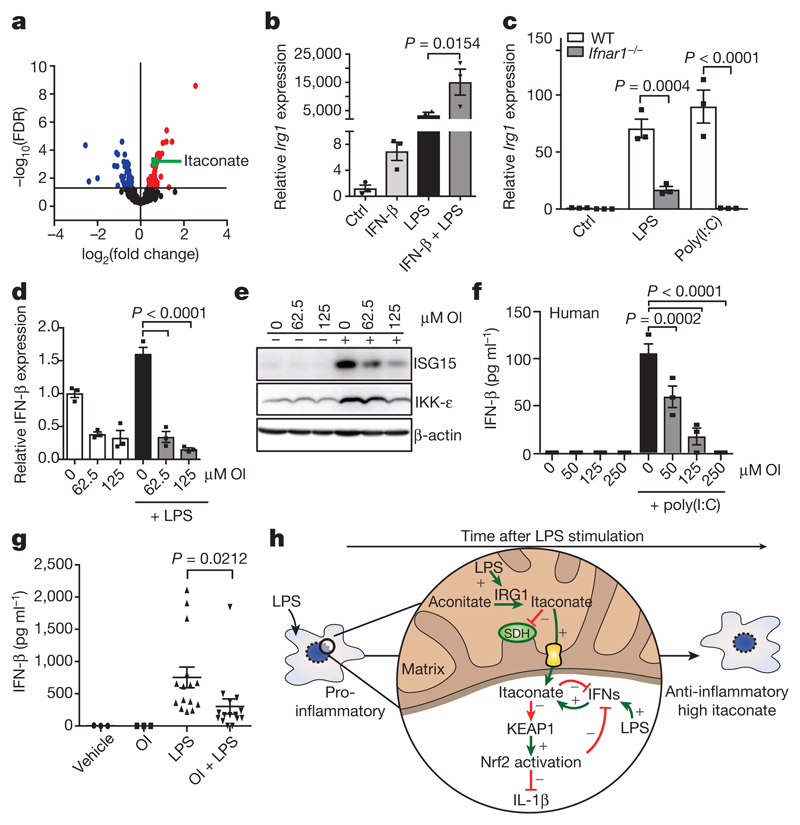
The endogenous metabolite itaconate has recently emerged as a regulator of macrophage function, but its precise mechanism of action remains poorly understood. Here we show that itaconate is required for the activation of the anti-inflammatory transcription factor Nrf2 (also known as NFE2L2) by lipopolysaccharide in mouse and human macrophages. We find that itaconate directly modifies proteins via alkylation of cysteine residues. Itaconate alkylates cysteine residues 151, 257, 288, 273 and 297 on the protein KEAP1, enabling Nrf2 to increase the expression of downstream genes with anti-oxidant and anti-inflammatory capacities. The activation of Nrf2 is required for the anti-inflammatory action of itaconate. We describe the use of a new cell-permeable itaconate derivative, 4-octyl itaconate, which is protective against lipopolysaccharide-induced lethality in vivo and decreases cytokine production. We show that type I interferons boost the expression of Irg1 (also known as Acod1) and itaconate production. Furthermore, we find that itaconate production limits the type I interferon response, indicating a negative feedback loop that involves interferons and itaconate. Our findings demonstrate that itaconate is a crucial anti-inflammatory metabolite that acts via Nrf2 to limit inflammation and modulate type I interferons.


Conflict of interest statement

The authors declare no competing interests.

Figures

Extended Data Figure 1
Extended Data Figure 1. The effect of itaconate on complex II activity.
a, Complex II and III activity in bovine heart mitochondrial membranes incubated with succinate plus malonate or itaconate (n = 3 independent experiments). b, Effect of malonate or itaconate on the oxygen consumption rate (OCR) of rat liver mitochondria in the presence of succinate (1 mM) and FCCP (1 μM; n = 3 independent experiments). c, d, Complex II and III activity in bovine heart mitochondrial membranes incubated with itaconate (IA; 1 mM unless indicated), with subsequent removal and addition of succinate (1 mM; n = 3 independent experiments) (see Methods for further details). Data are mean ± s.e.m. P values calculated using one or two-way ANOVA.
Extended Data Figure 2
Extended Data Figure 2. DMI activates Nrf2 and limits cytokine production.
a, c, LPS (100 ng ml−1)-induced Nrf2 (a, 24 h) and HMOX1 (c, 6 h) protein expression with or without the itaconate derivative DMI. b, Nrf2-dependent mRNA expression after treatment with LPS (6 h) and DMI where indicated (n = 3). d, Reduced glutathione (GSH) and oxidized glutathione (GSSG) levels after treatment with LPS and DMI (n = 5). e, f, LPS (24 h)-induced Il1b mRNA (e), IL-1β and HIF-1α protein (f) expression in mouse macrophages with or without DMI (n = 3). Data are mean ± s.e.m. P values calculated using one-way ANOVA. Blots are representative of three independent experiments. For gel source data, see Supplementary Fig. 1.
Extended Data Figure 3
Extended Data Figure 3. OI is the best tool to assess itaconate-dependent Nrf2 activity.
a, Reactivity of DMI, itaconate and OI with thiols. b, c, Itaconate ester reactivity with GSH and glutathione-S-transferase (GST) as detailed in the Methods (n = 3). d, Itaconate levels in mouse C2C12 cells plus itaconate esters (n = 3). MI, 4-methyl itaconate. e, i, Itaconate (e) or GSH (i) levels plus LPS (6 h) and OI as indicated (n = 5). f, NQO1 activity in mouse Hepa1c1c7 cells treated with DMI or OI (48 h) and GSH (n = 8). g, h, Metabolic intermediates in GSH synthesis (h, average of five biological replicates). i, GSH levels after treatment with LPS (6 h) and/or OI (n = 5). j, GSH/GSSG ratio after treatment with OI (2 h) and H2O2 (100 μM, 24 h; n = 3) as indicated. k, HMOX1 protein levels after treatment with OI and/or H2O2 (24 h). l, Nrf2, HMOX1 and IL-1β protein levels in BMDMs pre-treated with OI, 4-octyl 2-methylsuccinate (OMS) or octyl succinate (OS), all 125 μM for 3 h with or without LPS (6 h). m, LPS-induced Nrf2 (24 h) and HMOX1 (6 h) protein expression with or without dimethyl malonate (DMM). Data are mean ± s.e.m. P values calculated using one- or two-way ANOVA. Blots are representative of three independent experiments. For gel source data, see Supplementary Fig. 1.
Extended Data Figure 4
Extended Data Figure 4. Itaconate is transported by the mitochondrial oxoglutarate, dicarboxylate and citrate carriers.
a, Itaconate uptake into vesicles of Lactococcus lactis membranes expressing the indicated carriers loaded with itaconate (1 mM), and transport initiated by the addition of [3H]itaconate (1 μM). b, Initial transport rates of each carrier with either canonical substrate (homo-exchange) or canonical substrate/itaconate (hetero-exchange). n = 4 independent experiments; data are mean ± s.d. P values calculated using two-tailed Student’s t-test.
Extended Data Figure 5
Extended Data Figure 5. KEAP1 is alkylated by OI on major redox sensing cysteine residues.
a, Modification of cysteine by fumarate or itaconate. Tandem mass spectrometry spectrum of KEAP1 Cys257 (b), Cys257 (c) and Cys288 (d) peptides, indicating alkylation of these sites after OI treatment (left) but not in the corresponding carbamidomethylated (CAM) peptides (right). e, f, LDHA Cys84 alkylation after treatment with LPS (e, 24 h) or OI (f, 250 μM, 4 h) (n = 4). Detected N- and C-terminal fragment ions of both peptides are assigned in the spectrum and depicted as follows: b: N-terminal fragment ion; y: C-terminal fragment ion; asterisk: fragment ion minus NH3; 0 or asterisk: fragment ion minus H2O; and 2+: doubly charged fragment ion. Representative of one independent experiment.
Extended Data Figure 6
Extended Data Figure 6. Identification of an itaconate-cysteine adduct.
ae, 13C6-glucose (ac) or 13C5-glutamine (d, e) labelling experiment tracking itaconate-cysteine adduct formation in BMDMs treated with LPS (n = 5; 24 h). Data in b and e are expressed as the percentage isotopologue of the total pool. Data in c and f represent changes in the total pool after LPS treatment. Data are mean ± s.e.m., for five replicates. P values calculated using two-way ANOVA.
Extended Data Figure 7
Extended Data Figure 7. OI decreases LPS-induced cytokine production, extracellular acidification rate, ROS and nitric oxide.
a, Percentage cytotoxicity (LDH release) in BMDMs after treatment with LPS and OI as indicated (n = 3). b, LPS-induced extracellular acidification rate (ECAR) after treatment with OI and/or LPS as indicated, analysed on the Seahorse XF-24 in BMDMs (trace representative of three independent experiments). c, d, LPS-induced Il10 mRNA (c, 4 h) and protein (d, 24 h) and TNF protein (f; n = 7) after OI treatment as indicated (n = 3). e, Phosphorylated p65 (pp65) protein levels (a measure of NF-κB activity) after treatment with LPS and OI as indicated. h, Representative gating strategy for FACS analysis of ROS production in cells as treated in d (image representative of three independent experiments). i, LPS-induced NOS2 expression (n = 6), with or without OI treatment. j, LPS-induced TNF (n = 4) and IL-1β (n = 3) protein levels after OI treatment in PBMCs. k, Nrf2 and HMOX1 protein levels or Nrf2-dependent gene expression (n = 5) in peritoneal macrophages from mice (m) injected intraperitoneally with OI (50 mg kg−1, 6 h) or vehicle control. l, Serum IL-10 from mice injected intraperitoneally with vehicle control or OI (50 mg kg−1, 2 h) and LPS (2.5 mg kg−1, 2 h, n = 3 vehicle, OI; n = 15 LPS, OI plus LPS). Data are mean ± s.e.m. P values calculated using one-way ANOVA. Blots are representative of three independent experiments. For gel source data, see Supplementary Fig. 1.
Extended Data Figure 8
Extended Data Figure 8. The effects of OI on cytokine production are Nrf2-dependent.
ae, Nrf2, HMOX1 and IL-1β protein levels (a, c, d) and Il1b mRNA expression (b, e) in mouse BMDMs transfected with two different Nrf2 siRNAs (50 nM) compared with a non-silencing scrambled control siRNA plus LPS (6 h; ac, e; 24 h; d) and/or OI (n = 6). NT, non-transfected. f, Il1b mRNA expression in wild-type and Nrf2-knockout BMDMs treated with LPS (24 h; WT n = 2, Nrf2 KO n = 4) and/or OI. gk, Il1b (g) and Nos2 (j) mRNA, and IL-1β (h), IL-10 (i), TNF and nitrite (k) production with or without LPS (24 h), diethyl maleate (DEM; 100 μM) or 15-deoxy-Δ12,14-prostaglandin J2 (J2; 5 μM) pre-treatment for 3 h (n = 3). Data are mean ± s.e.m. P values calculated using one-way ANOVA. Blots are representative of three independent experiments. For gel source data, see Supplementary Fig. 1.
Extended Data Figure 9
Extended Data Figure 9. An Nrf2-dependent feedback loop exists between itaconate and IFN-β.
a, Metabolite levels after treatment with IFN-β (1,000 U ml−1; 27 h; n = 5). b, c, Isg20 and Irf5 mRNA expression in BMDMs treated with LPS (b) or poly(I:C) (c, 40 μg ml−1; 24 h) and/or OI (n = 6). d, Il10 mRNA (n = 3) and IL-10 protein (n = 5) expression after treatment with LPS for 4 h (left) or 24 h (right) and/or IFN-β treatment (1,000 U ml−1) for 3 h. e, Isg20 expression in BMDMs transfected with two different Nrf2 siRNAs (50 nM) compared with non-silencing control plus LPS (6 h) and/or OI (n = 6). f, Isg20 mRNA expression in wild-type (n = 2) and Nrf2-knockout (n = 4) BMDMs plus LPS (6 h) and/or OI. g, Isg20 mRNA expression after pre-treatment with LPS (24 h) and/or diethyl maleate (100 μM) or 15-deoxy-Δ12,14-prostaglandin J2 (5 μM) for 3 h (n = 3). Data are mean ± s.e.m. P values calculated using one-way ANOVA.
Figure 1
Figure 1. Itaconate activates Nrf2.
ac, Metabolite levels and itaconate abundance in control (ctrl) versus LPS-induced (a, n = 12, 4 h; b, c, n = 5, 24 h) human (a) and mouse (b, c) macrophages. Red and blue dots represent metabolites significantly up- and downregulated by LPS, respectively. FDR, false discovery rate. d, Reactivity of itaconate with KEAP1 thiol group. e, g, LPS-induced Nrf2 (e, 24 h) and HMOX1 (g, 6 h) after treatment with OI as indicated. f, Nrf2 target gene expression in mouse macrophages with or without LPS (6 h) and OI (Nqo1, Gclm, Hmox1, n = 12; Gsr, Pgd, Taldo1, n = 6). h, NQO1 activity in mouse Hepa1c1c7 cells treated as indicated (48 h, n = 8). Data are mean ± s.e.m. P values calculated using one-way or two-way analysis of variance (ANOVA) for multiple comparisons or two-tailed Student’s t-test for paired comparisons. Blots are representative of three independent experiments. In the box plots, line shows mean. For gel source data, see Supplementary Fig. 1.
Figure 2
Figure 2. Itaconate alkylates cysteines.
a, Itaconate transport by the indicated carriers(n = 4). HsAAC1, Homo sapiens ADP/ATP carrier; HsCTP, H. sapiens citrate carrier; HsODC, H. sapiens oxodicarboxylate carrier; HsOGC, H. sapiens 2-oxoglutarate carrier; ScAAC2, Saccharomyces cerevisiae ADP/ATP carrier; ScDIC, S. cerevisiae dicarboxylate carrier. b, Nrf2 and KEAP1 protein after co-transfection with Nrf2–V5, and the wild-type (WT) or Cys151Ser mutant KEAP1. c, Tandem mass spectrometry spectrum of Cys151-containing KEAP1 peptide after OI treatment. d, Metabolite (13C6-glucose (left), 13C5-glutamine (right)) tracing to itaconate-cysteine adduct with or without LPS (24 h, n = 5). AU, arbitrary units. e, LDHA Cys84 alkylation plus LPS (24 h) or OI (250 μM, 4 h) (n = 4). Data are mean ± s.e.m. (in d, e) or s.d. (in a). P values calculated using one-way ANOVA for multiple comparisons or two-tailed Student’s t-test for paired comparisons. Blots are representative of three independent experiments. For gel source data, see Supplementary Fig. 1.
Figure 3
Figure 3. OI limits IL-1β in an Nrf2-dependent manner and protects against LPS lethality.
ad, LPS (24 h) induced Il1b mRNA (a, n = 3), IL-1β and HIF-1α protein (b), ROS production (c, n = 3; measured as the percentage change in mean fluorescent intensity (MFI) relative to untreated control) and nitrite production (d, n = 3) ± OI. e, IL1B mRNA in human PBMCs treated as in ad (n = 3). f, Survival (left), clinical score (middle) and body temperature (right) measurements in mice (n = 10) injected intraperitoneally with OI (50 mg kg−1, 2 h) and LPS (15 mg kg−1). g, Serum IL-1β and TNF levels from mice injected intraperitoneally with OI (50 mg kg−1, 2 h) and/or LPS (2.5 mg kg−1, 2 h, n = 3 vehicle, OI; n = 15 LPS, OI plus LPS). h, Nrf2, HMOX1 and IL-1β protein in wild-type and Nrf2 knockout (KO) mouse BMDMs treated with LPS (6 h) and OI as indicated. Data are mean ± s.e.m. P values calculated using one-way ANOVA. Blots are representative of three independent experiments. For gel source data, see Supplementary Fig. 1.
Figure 4
Figure 4. A feedback loop exists between itaconate and IFN-β.
a, Metabolite levels in control versus IFN-β-treated (1,000 U ml−1; 27 h; n = 5) mouse macrophages. b, LPS-induced (24 h) Irg1 expression ± IFN-β (1,000 U ml−1; n = 3). c, Irg1 expression in wild-type and IFN receptor-deficient (Ifnar1−/−) BMDMs plus LPS or poly(I:C) (40 μg ml−1) for 24 h (n = 3). d, IFN-β (n = 3) expression plus LPS (24 h) and OI as indicated. e, ISG15 and IKK-ε expression after treatment with LPS (24 h) and OI. f, IFN-β protein expression in PBMCs treated with poly(I:C) (20 μg ml−1; 24 h) and OI (n = 3) as indicated. g, Serum IFN-β levels from mice injected intraperitoneally with OI (50 mg kg−1, 2 h) with or without LPS (2.5 mg kg−1; 2 h) (n = 3 vehicle, OI; n = 15 LPS, OI and LPS). h, The anti-inflammatory role of itaconate. Data are mean ± s.e.m. P values calculated using one-way ANOVA. Blots are representative of three independent experiments. Data in f are representative from one of two human donors. For gel source data, see Supplementary Fig. 1.

Comment in

References

    1. Michelucci A, et al. Immune-responsive gene 1 protein links metabolism to immunity by catalyzing itaconic acid production. Proc Natl Acad Sci USA. 2013;110:7820–7825. - PMC - PubMed
    1. Strelko CL, et al. Itaconic acid is a mammalian metabolite induced during macrophage activation. J Am Chem Soc. 2011;133:16386–16389. - PMC - PubMed
    1. Lampropoulou V, et al. Itaconate links inhibition of succinate dehydrogenase with macrophage metabolic remodeling and regulation of inflammation. Cell Metab. 2016;24:158–166. - PMC - PubMed
    1. Mills EL, et al. Succinate dehydrogenase supports metabolic repurposing of mitochondria to drive inflammatory macrophages. Cell. 2016;167:457–470. - PMC - PubMed
    1. Hayes JD, Dinkova-Kostova AT. The Nrf2 regulatory network provides an interface between redox and intermediary metabolism. Trends Biochem Sci. 2014;39:199–218. - PubMed

Publication types

MeSH terms