

Tissue-specific impact of FADS cluster variants on FADS1 and FADS2 gene expression
- PMID: 29590160
- PMCID: PMC5874031
- DOI: 10.1371/journal.pone.0194610
Tissue-specific impact of FADS cluster variants on FADS1 and FADS2 gene expression
Abstract
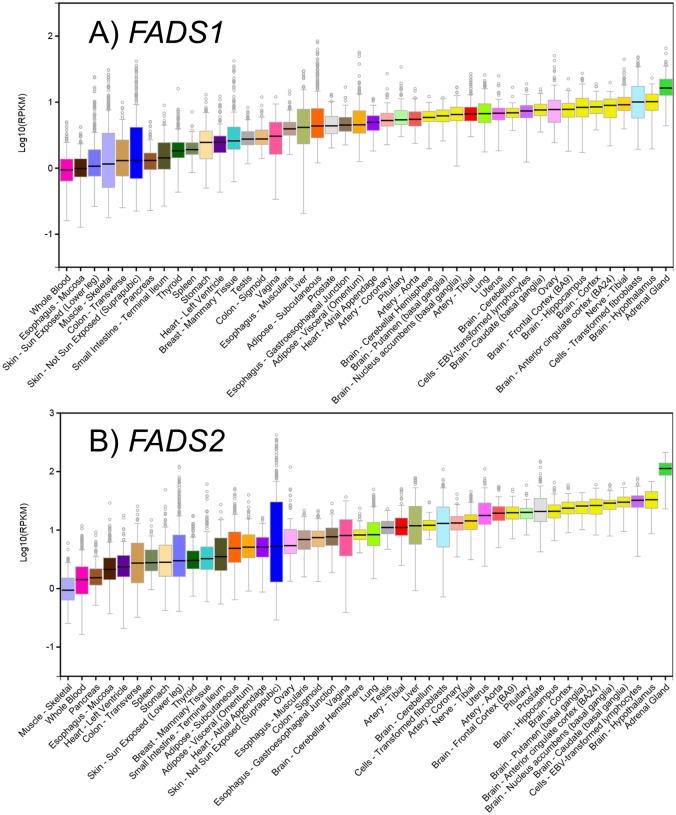
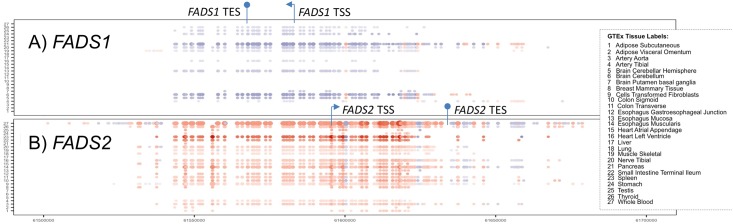
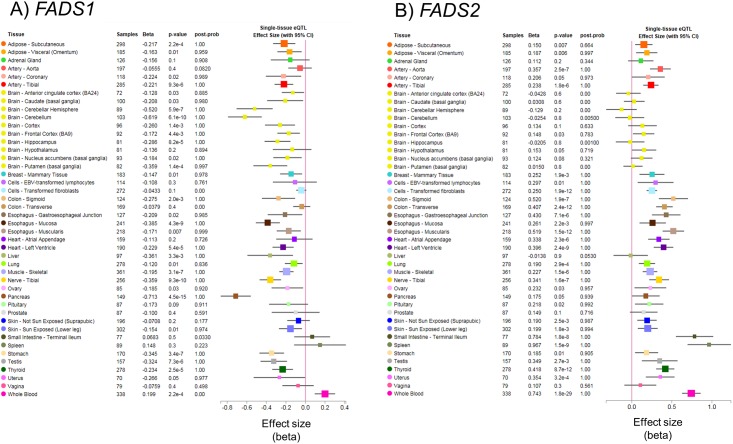
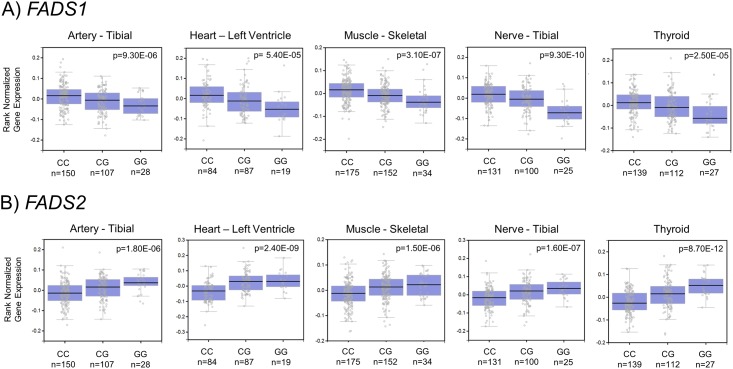
Omega-6 (n-6) and omega-3 (n-3) long (≥ 20 carbon) chain polyunsaturated fatty acids (LC-PUFAs) play a critical role in human health and disease. Biosynthesis of LC-PUFAs from dietary 18 carbon PUFAs in tissues such as the liver is highly associated with genetic variation within the fatty acid desaturase (FADS) gene cluster, containing FADS1 and FADS2 that encode the rate-limiting desaturation enzymes in the LC-PUFA biosynthesis pathway. However, the molecular mechanisms by which FADS genetic variants affect LC-PUFA biosynthesis, and in which tissues, are unclear. The current study examined associations between common single nucleotide polymorphisms (SNPs) within the FADS gene cluster and FADS1 and FADS2 gene expression in 44 different human tissues (sample sizes ranging 70-361) from the Genotype-Tissue Expression (GTEx) Project. FADS1 and FADS2 expression were detected in all 44 tissues. Significant cis-eQTLs (within 1 megabase of each gene, False Discovery Rate, FDR<0.05, as defined by GTEx) were identified in 12 tissues for FADS1 gene expression and 23 tissues for FADS2 gene expression. Six tissues had significant (FDR< 0.05) eQTLs associated with both FADS1 and FADS2 (including artery, esophagus, heart, muscle, nerve, and thyroid). Interestingly, the identified eQTLs were consistently found to be associated in opposite directions for FADS1 and FADS2 expression. Taken together, findings from this study suggest common SNPs within the FADS gene cluster impact the transcription of FADS1 and FADS2 in numerous tissues and raise important questions about how the inverse expression of these two genes impact intermediate molecular (such a LC-PUFA and LC-PUFA-containing glycerolipid levels) and ultimately clinical phenotypes associated with inflammatory diseases and brain health.
Conflict of interest statement
Figures
Similar articles
-
FADS1-FADS2 genetic polymorphisms are associated with fatty acid metabolism through changes in DNA methylation and gene expression.Clin Epigenetics. 2018 Aug 29;10(1):113. doi: 10.1186/s13148-018-0545-5. Clin Epigenetics. 2018. PMID: 30157936 Free PMC article.
-
Nutrigenetics and Omega-3 and Gamma-Linolenic Acid Intake and Status in Patients with Cancer: A PRISMA Scoping Review of Research Trends and Challenges.Int J Mol Sci. 2025 May 19;26(10):4867. doi: 10.3390/ijms26104867. Int J Mol Sci. 2025. PMID: 40430008 Free PMC article.
-
Associations between variants of FADS genes and omega-3 and omega-6 milk fatty acids of Canadian Holstein cows.BMC Genet. 2014 Feb 17;15:25. doi: 10.1186/1471-2156-15-25. BMC Genet. 2014. PMID: 24533445 Free PMC article.
-
FADS gene cluster polymorphisms: important modulators of fatty acid levels and their impact on atopic diseases.J Nutrigenet Nutrigenomics. 2009;2(3):119-28. doi: 10.1159/000235559. Epub 2009 Sep 23. J Nutrigenet Nutrigenomics. 2009. PMID: 19776639 Review.
-
Genome-Wide Association Study for Serum Omega-3 and Omega-6 Polyunsaturated Fatty Acids: Exploratory Analysis of the Sex-Specific Effects and Dietary Modulation in Mediterranean Subjects with Metabolic Syndrome.Nutrients. 2020 Jan 24;12(2):310. doi: 10.3390/nu12020310. Nutrients. 2020. PMID: 31991592 Free PMC article.
Cited by
-
International Society for the Study of Fatty Acids and Lipids 2018 Symposium: Arachidonic and Docosahexaenoic Acids in Infant Development.Ann Nutr Metab. 2019;74(1):83-91. doi: 10.1159/000495906. Epub 2019 Jan 7. Ann Nutr Metab. 2019. PMID: 30616237 Free PMC article. No abstract available.
-
Marginal Zinc Deficiency Alters Essential Fatty Acid Metabolism in Healthy Men.J Nutr. 2022 Mar 3;152(3):671-679. doi: 10.1093/jn/nxab425. J Nutr. 2022. PMID: 34919682 Free PMC article.
-
Individual non-esterified fatty acids and incident atrial fibrillation late in life.Heart. 2021 Nov;107(22):1805-1812. doi: 10.1136/heartjnl-2020-317929. Epub 2021 Jan 22. Heart. 2021. PMID: 33483356 Free PMC article.
-
Identification of SLC31A1 as a prognostic biomarker and a target for therapeutics in breast cancer.Sci Rep. 2024 Oct 24;14(1):25120. doi: 10.1038/s41598-024-76162-x. Sci Rep. 2024. PMID: 39448672 Free PMC article.
-
The FADS1 rs174550 Genotype Modifies the n-3 and n-6 PUFA and Lipid Mediator Responses to a High Alpha-Linolenic Acid and High Linoleic Acid Diets.Mol Nutr Food Res. 2022 Dec;66(24):e2200351. doi: 10.1002/mnfr.202200351. Epub 2022 Nov 11. Mol Nutr Food Res. 2022. PMID: 36367234 Free PMC article. Clinical Trial.
References
-
- Burr GO, Burr MM. On the nature and role of the fatty acids essential in nutrition. J Biol Chem. 1930;86:587–621.
-
- Burr GO, Burr MM. A new deficiency disease produced by the rigid exclusion of fat from the diet. J Biol Chem. 1929;82:345–67. - PubMed
-
- Sprecher H. Biochemistry of essential fatty acids. Prog Lipid Res. 1981;20:13–22. - PubMed
-
- Chilton FH, Murphy RC, Wilson BA, Sergeant S, Ainsworth H, Seeds MC, et al. Diet-gene interactions and PUFA metabolism: A potential contributor to health disparities and human diseases. Nutrients. 2014;6(5):1993–2022. doi: 10.3390/nu6051993 - DOI - PMC - PubMed
Publication types
MeSH terms
Substances
Grants and funding
LinkOut - more resources
Full Text Sources
Other Literature Sources
