. 2018 Sep 15;34(18):3160-3168.
doi: 10.1093/bioinformatics/bty182.

GENEASE: real time bioinformatics tool for multi-omics and disease ontology exploration, analysis and visualization

Affiliations

GENEASE: real time bioinformatics tool for multi-omics and disease ontology exploration, analysis and visualization

Sudhir Ghandikota et al. Bioinformatics. .

Abstract

Motivation: Advances in high-throughput sequencing technologies have made it possible to generate multiple omics data at an unprecedented rate and scale. The accumulation of these omics data far outpaces the rate at which biologists can mine and generate new hypothesis to test experimentally. There is an urgent need to develop a myriad of powerful tools to efficiently and effectively search and filter these resources to address specific post-GWAS functional genomics questions. However, to date, these resources are scattered across several databases and often lack a unified portal for data annotation and analytics. In addition, existing tools to analyze and visualize these databases are highly fragmented, resulting researchers to access multiple applications and manual interventions for each gene or variant in an ad hoc fashion until all the questions are answered.

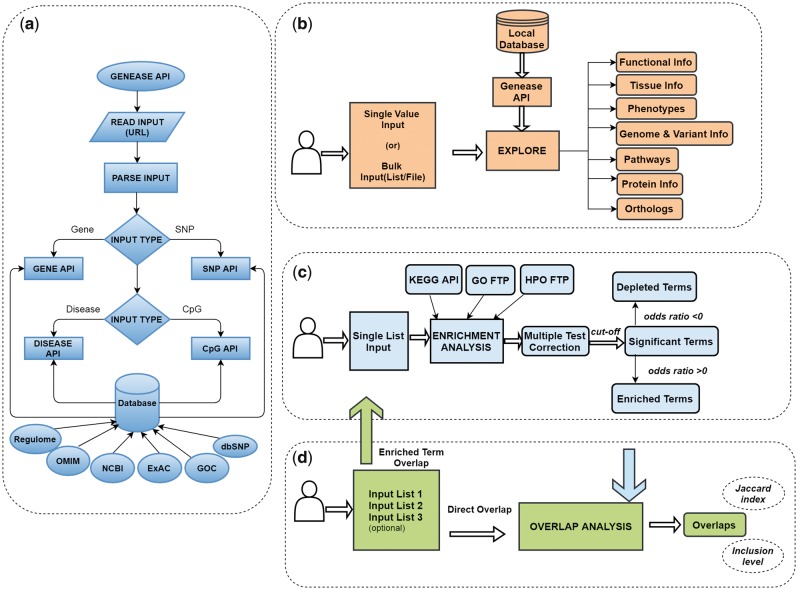
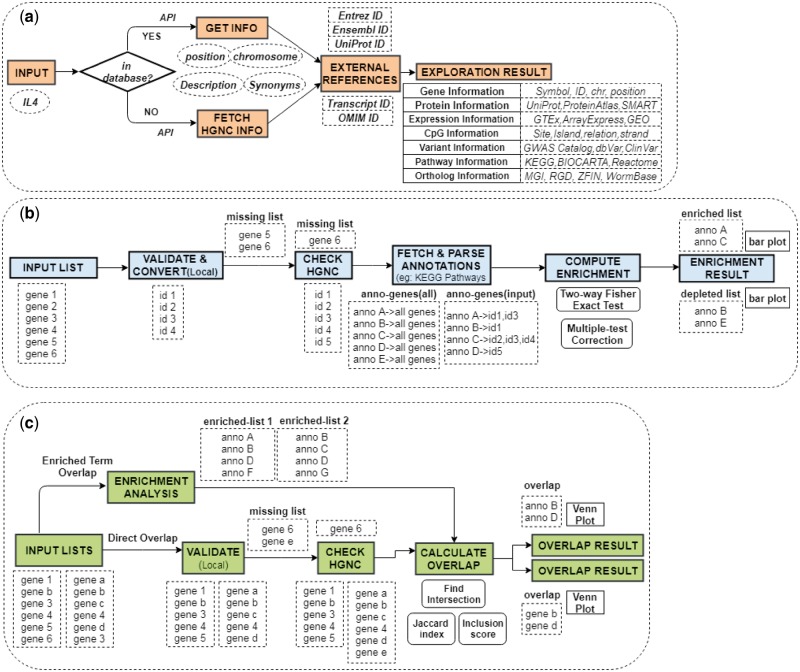
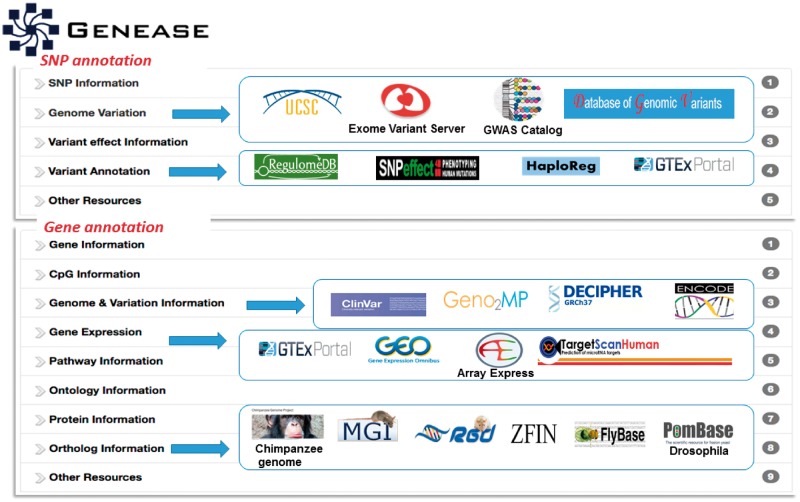
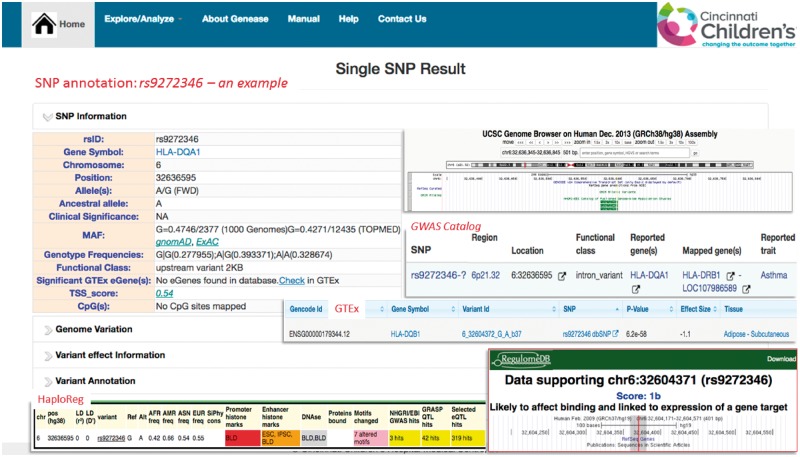
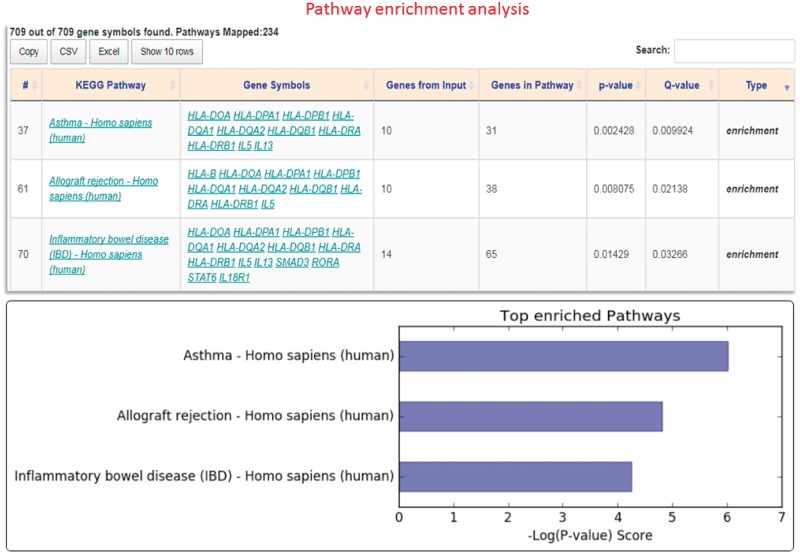
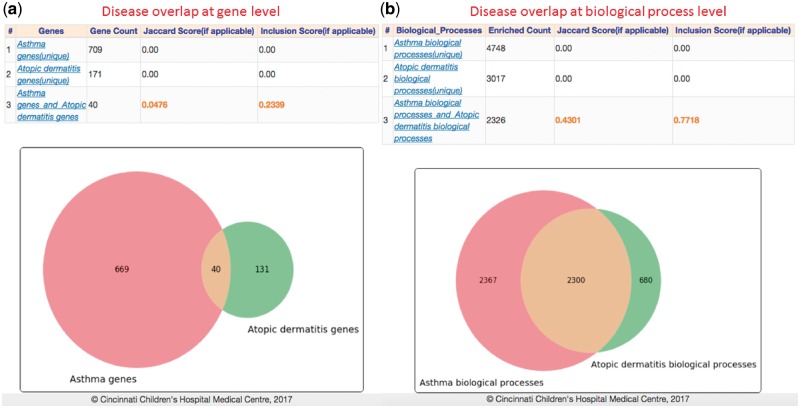
Results: In this study, we present GENEASE, a web-based one-stop bioinformatics tool designed to not only query and explore multi-omics and phenotype databases (e.g. GTEx, ClinVar, dbGaP, GWAS Catalog, ENCODE, Roadmap Epigenomics, KEGG, Reactome, Gene and Phenotype Ontology) in a single web interface but also to perform seamless post genome-wide association downstream functional and overlap analysis for non-coding regulatory variants. GENEASE accesses over 50 different databases in public domain including model organism-specific databases to facilitate gene/variant and disease exploration, enrichment and overlap analysis in real time. It is a user-friendly tool with point-and-click interface containing links for support information including user manual and examples.

Availability and implementation: GENEASE can be accessed freely at http://research.cchmc.org/mershalab/GENEASE/login.html.

Supplementary information: Supplementary data are available at Bioinformatics online.


Figures

Fig. 1.
Fig. 1.
GENEASE workflows: (a) GENEASE API used to retrieve gene, SNP, disease or CpG site information from local database. (b) Exploration module, begins with reading the input types from the explore screen. Local API used to extract information if the input is found and external database links are included in the final result. (c) Enrichment analysis module, starts with reading the gene/SNP lists from the analysis screen. Functional annotations are accessed and parsed on-the-fly and statistical tests are performed to test for enrichment. Multiple test correction procedures are employed and odds ratio is used to find enrichment/depletion. (d) Overlap analysis module firstly reads the gene/SNP sets supplied by the user. In case of direct overlap, intersections are found and overlap scores are computed directly. For enriched term overlap analysis, enrichment analysis module is used to retrieve the enriched terms in each of the sets and overlap is computed using them (Color version of this figure is available at Bioinformatics online.)
Fig. 2.
Fig. 2.
GENEASE module procedures: (a) Step-by-step procedures followed in Exploration module including the conditional validation procedure. External references are downloaded and appended to external links to form dynamic requests. (b) All steps of enrichment module including the two-step validation. Annotation data is downloaded in run-time and input ‘hit’ counts processed for significance tests. (c) Summary of procedures followed in overlap analysis. Enrichment analysis performed before computing the overlaps in case of ‘enriched term overlap’ case (Color version of this figure is available at Bioinformatics online.)
Fig. 3.
Fig. 3.
Exploration module: Result interface of exploration module includes multiple information ‘sliders’. SNP information and gene information sliders include gene/SNP descriptive information about the SNP or gene. Other sliders contain links to functional omics external resources for non-coding variants including RegulomeDB, HaploReg, GTEx and SNPeffect, etc. (Color version of this figure is available at Bioinformatics online.)
Fig. 4.
Fig. 4.
Exploration—example: SNP explore result for rs9272346 with snapshots of non-coding variant annotations databases including RegulomeDB, HaploReg, GTEx and Roadmap Epigenomics (Color version of this figure is available at Bioinformatics online.)
Fig. 5.
Fig. 5.
Pathway enrichment analysis: Result interface having downloadable HTML table listing pathways and corresponding gene counts. Bar plot of top enriched pathways is also included (Color version of this figure is available at Bioinformatics online.)
Fig. 6.
Fig. 6.
Gene and ontology overlap analysis: Computed results for overlap among genes and biological processes associated with asthma and atopic dermatitis (extracted from GWAS Catalog). Both overlap analysis result tables contains the computed similarity and inclusion scores and Venn diagrams illustrating the overlap levels (Color version of this figure is available at Bioinformatics online.)

Similar articles

Cited by

References

    1. Andreatta M. et al. (2011) NNAlign: a web-based prediction method allowing non-expert end-user discovery of sequence motifs in quantitative peptide data. PLoS One, 6, e26781.. - PMC - PubMed
    1. Benjamini Y., Hochberg Y. (1995) Controlling the false discovery rate: a practical and powerful approach to multiple testing. J. R. Stat. Soc., 57, 12.
    1. Chen E.Y. et al. (2013) Enrichr: interactive and collaborative HTML5 gene list enrichment analysis tool. BMC Bioinformatics, 14, 128.. - PMC - PubMed
    1. Chen J. et al. (2009) ToppGene Suite for gene list enrichment analysis and candidate gene prioritization. Nucleic Acids Res., 37, W305–W311. ' - PMC - PubMed
    1. Eck N.J.v., Waltman L. (2009), How to normalize co-occurrence data? An analysis of some well-known similarity measures, In: ERIM report series research in management, Erasmus Research Institute of Management, (January 2009), p. 42.

Publication types