. 2018 Mar 27;114(6):1377-1388.
doi: 10.1016/j.bpj.2018.01.036.

Entropic Control of Receptor Recycling Using Engineered Ligands

Affiliations

Entropic Control of Receptor Recycling Using Engineered Ligands

Andre C M DeGroot et al. Biophys J. .

Abstract

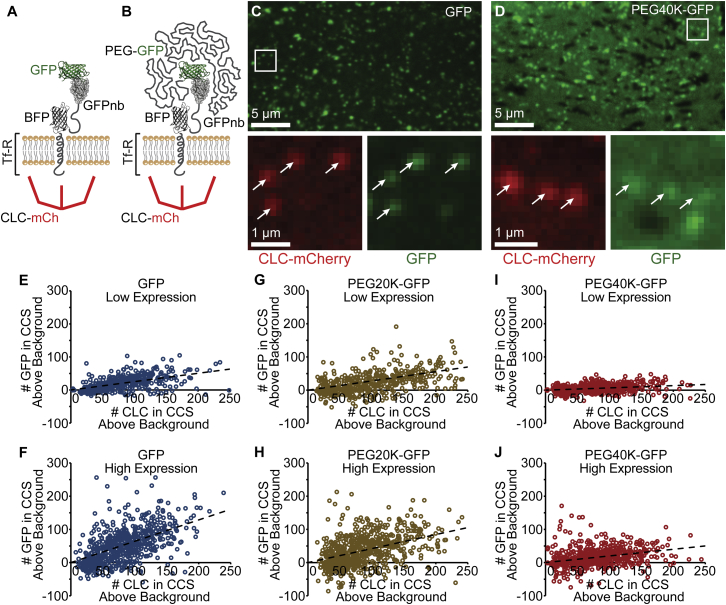
Receptor internalization by endocytosis regulates diverse cellular processes, from the rate of nutrient uptake to the timescale of essential signaling events. The established view is that internalization is tightly controlled by specific protein-binding interactions. However, recent work suggests that physical aspects of receptors influence the process in ways that cannot be explained by biochemistry alone. Specifically, work from several groups suggests that increasing the steric bulk of receptors may inhibit their uptake by multiple types of trafficking vesicles. How do biochemical and biophysical factors work together to control internalization? Here, we show that receptor uptake is well described by a thermodynamic trade-off between receptor-vesicle binding energy and the entropic cost of confining receptors within endocytic vesicles. Specifically, using large ligands to acutely increase the size of engineered variants of the transferrin receptor, we demonstrate that an increase in the steric bulk of a receptor dramatically decreases its probability of uptake by clathrin-coated structures. Further, in agreement with a simple thermodynamic analysis, all data collapse onto a single trend relating fractional occupancy of the endocytic structure to fractional occupancy of the surrounding plasma membrane, independent of receptor size. This fundamental scaling law provides a simple tool for predicting the impact of receptor expression level, steric bulk, and the size of endocytic structures on receptor uptake. More broadly, this work suggests that bulky ligands could be used to drive the accumulation of specific receptors at the plasma membrane surface, providing a biophysical tool for targeted modulation of signaling and metabolism from outside the cell.


Figures

Figure 1
Figure 1
A model receptor-ligand system enables acute increases in receptor size. (A and B) A schematic of chimeric receptors bound to GFP (A) or PEG-GFP (B) ligands is shown. (C) This schematic shows GFP-bound model receptors being incorporated into clathrin-coated structures. (D) A spinning disk confocal image at the plasma membrane of an RPE cell transiently expressing TfR-Δecto-RFP-GFPnb receptor incubated with 500 nM GFP ligand is shown. The box in the top image represents the location of the insets. Bar plots show intensity profiles for the boxed reference punctum in the inset. (E) The intensity of punctate structures in a single cell is well colocalized in the GFP and RFP fluorescent channels (54 puncta; slope is 1.61; R2 of the linear fit is 0.81). (F) A spinning disk confocal image at the plasma membrane of an RPE cell transiently expressing TfR-Δecto-RFP-GFPnb receptor incubated with 500 nM PEG40K-GFP ligand is shown. The box in the top image represents the location of the insets. (G and H) The intensity of punctate structures in a single cell is well colocalized in the PEG20K-GFP (G) and RFP fluorescent channels (86 puncta; slope is 1.27; R2 of the linear fit is 0.81) and (H) PEG40K-GFP and RFP fluorescent channels (59 puncta; slope is 1.26; R2 of the linear fit is 0.61). AU, arbitrary units. To see this figure in color, go online.
Figure 2
Figure 2
Model receptors are incorporated into clathrin-coated structures (CCSs) according to receptor expression level, CCS size, and ligand size. (A and B) A schematic of chimeric receptors bound to GFP (A) or PEG-GFP (B) is shown. (C and D) A spinning disk confocal image at the plasma membrane surface of an RPE cell stably expressing mCherry-tagged clathrin light chain (CLC) transiently transfected with TfR-Δecto-BFP-GFPnb receptor and incubated with 500 nM GFP (C) or PEG40K-GFP (D) is shown. The arrows mark CCSs (mCherry) and colocalized puncta in the GFP ligand channel. The boxes in the top images represent insets. (EJ) The incorporation of GFP or PEG-GFP ligand into CCSs is shown as a function of the number of mCherry per CCS for individual cells stably expressing CLC-mCherry and transfected with TfR-Δecto-BFP-GFPnb when incubated with 500 nM ligand. The incorporation of the GFP ligand (281 GFP per μm2, 485 puncta) (E), PEG20K-GFP ligand (295 GFP per μm2, 523 puncta) (G), or PEG40K-GFP ligand (253 GFP per μm2, 720 puncta) (I) into CCSs in cells with relatively low plasma membrane density of the GFP-bound receptor is shown. The incorporation of the GFP ligand (577 GFP per μm2, 662 puncta) (F), PEG20K-GFP ligand (573 GFP per μm2, 698 puncta) (H), or PEG40K-GFP ligand (576 GFP per μm2, 566 puncta) (J) into CCSs in cells with relatively high plasma membrane density of the GFP-bound receptor is shown. The slopes of the best-fit lines for low and high expression levels were significantly different from one another for all ligand sizes. The slopes of the best-fit lines of each ligand size at high expression were also significantly different from one another, based on a two-sided t-test with an α-value of 0.05. To see this figure in color, go online.
Figure 3
Figure 3
Ligands do not perturb the stability of the receptor concentration at the plasma membrane or the relative timescales of receptor loading and CCS growth. (AJ) Data derived from TIRF images of RPE cells stably expressing mCherry-tagged CLC transiently transfected with TfR-Δecto-BFP-GFPnb receptor and incubated with 500 nM GFP or PEG40K-GFP ligand are shown. (A) A TIRF image shows a cell incubated with GFP ligand. (B and C) An image sequence depicts the maturation of a single CCS tracked over its entire lifetime when incubated with GFP (B) or PEG40K-GFP (C) ligands (top row, mCherry; bottom row, GFP). (D and E) Ligand incorporation into CCSs is shown as a function of CCS brightness for a single cell treated with 500 nM GFP (D, 145 puncta) or PEG40K-GFP (E, 119 puncta). The average GFP background intensity on the membrane was similar for the cells shown, which were imaged using identical settings (19,867 A.U. for GFP and 20,181 A.U. for PEG40K-GFP). CCSs are reported for a single frame in a TIRF time-lapse movie. The slopes of the best-fit lines for GFP and PEG40K-GFP are significantly different, based on a two-sided t-test with α = 0.05. (F and G) Lifetime cohorts of tracked CCS intensities of the ligand-bound receptor (dashed line) and mCherry-CLC (solid line) when incubated with GFP (F) or PEG40K-GFP (G) are shown. 5299 CCSs from 21 total cells were analyzed in (F), and 4334 CLC-mCherry positive tracks from 12 total cells were analyzed in (G). (H) The lifetime distributions of CCSs are similar for cells treated with GFP and cells treated with PEG40K-GFP ligands. The average lifetime of all CLC-mCherry positive tracks across all lifetimes was 68 ± 2 s for untreated cells with no receptor expression, 72 ± 2 s for GFP-treated cells, and 70 ± 2 s for cells treated with PEG40K-GFP (N = 3025, 6129, and 4941 CCSs, respectively). (I and J) The normalized ligand concentration at the cell membrane is stable over multiple minutes for cells incubated with 500 nM GFP (I) or PEG40K-GFP (J) ligand. AU, arbitrary units. To see this figure in color, go online.
Figure 4
Figure 4
An equilibrium thermodynamic analysis explains reduced endocytic recruitment of receptors bound to bulky ligands. (A) A schematic of relative endocytic recruitment of model receptors bound to small (GFP) and large (PEG-GFP) ligands is shown. (B) A schematic of a Boltzmann lattice model is shown. There was ∼1 CCS per 2 μm2 of the plasma membrane surface area on average. (C) The average number of ligand-bound receptors per CCS is shown as a function of the local concentration of ligand-bound receptors on the plasma membrane surface for GFP, PEG20K-GFP, and PEG40K-GFP ligands. Each point represents the average of 250 puncta binned by ligand concentration on the surrounding membrane surface. Error bars represent the mean ± SE. Solid lines indicate model predictions using best fit vales of Δε and Ωp for GFP-bound receptors and size ratios for PEG20K-GFP and PEG40K-GFP-bound receptors, as described in the text. The root mean-square errors of the model in comparison to the experimental data in units of the number of GFP per CCS were 3.5 for GFP, 3.3 for PEG20K-GFP, and 3.8 for the PEG40K-GFP-bound receptor. (D) The average number of ligand-bound receptors per CCS is shown as a function of CCS capacity. Each point represents the average of 250 puncta binned by the total area of binding sites in the CCS. Error bars represent the mean ± SE. Solid lines indicate the best-fit linear regression. The R2 values for the solid lines are 0.96 for GFP, 0.94 for PEG20K-GFP, and 0.88 for PEG40K-GFP-bound receptor data. All slopes were significantly different from one another, based on a two-sided t-test with an α-value of 0.05. The dashed lines indicate model predictions for the slopes of the PEG20K-GFP and PEG40K-GFP-bound receptor data, which are scaled relative to the slope of the GFP-bound receptor data using the model-fit scaling factors determined from (C). (E) The fractional coverage of the CCS by the model receptor versus the fractional coverage of the plasma membrane surface by the model receptor is shown. Data are shown for receptors bound to GFP (circles), PEG20K-GFP (diamonds), and PEG40K-GFP (triangles). The black line indicates a model prediction from Eq. 3. The dashed line indicates a model prediction in the dilute regime, Eq. 4. The inset plots Eq. 3 for three values of the receptor-CCS binding energy. The plots (CE) show 117 points representing 29,288 puncta for GFP, 52 points representing 13,111 puncta for PEG20K-GFP, and 64 points representing 16,097 puncta for PEG40K-GFP. To see this figure in color, go online.

Comment in

References

    1. Sorkin A., von Zastrow M. Endocytosis and signalling: intertwining molecular networks. Nat. Rev. Mol. Cell Biol. 2009;10:609–622. - PMC - PubMed
    1. Harding C., Heuser J., Stahl P. Receptor-mediated endocytosis of transferrin and recycling of the transferrin receptor in rat reticulocytes. J. Cell Biol. 1983;97:329–339. - PMC - PubMed
    1. Davis C.G., Lehrman M.A., Goldstein J.L. The J.D. mutation in familial hypercholesterolemia: amino acid substitution in cytoplasmic domain impedes internalization of LDL receptors. Cell. 1986;45:15–24. - PubMed
    1. Goh L.K., Sorkin A. Endocytosis of receptor tyrosine kinases. Cold Spring Harb. Perspect. Biol. 2013;5:a017459. - PMC - PubMed
    1. Vieira A.V., Lamaze C., Schmid S.L. Control of EGF receptor signaling by clathrin-mediated endocytosis. Science. 1996;274:2086–2089. - PubMed

Publication types

LinkOut - more resources