. 2018 Mar 27;22(13):3401-3408.
doi: 10.1016/j.celrep.2018.03.018.

A Transcriptomic Signature of the Hypothalamic Response to Fasting and BDNF Deficiency in Prader-Willi Syndrome

Affiliations

A Transcriptomic Signature of the Hypothalamic Response to Fasting and BDNF Deficiency in Prader-Willi Syndrome

Elena G Bochukova et al. Cell Rep. .

Abstract

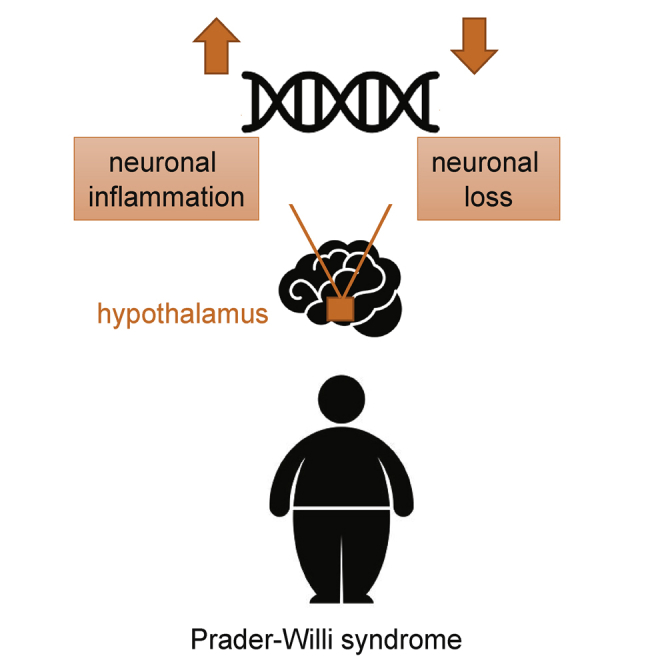
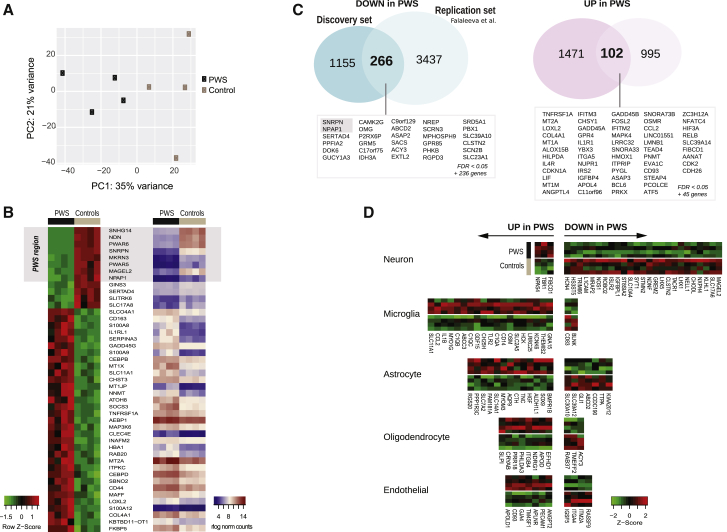
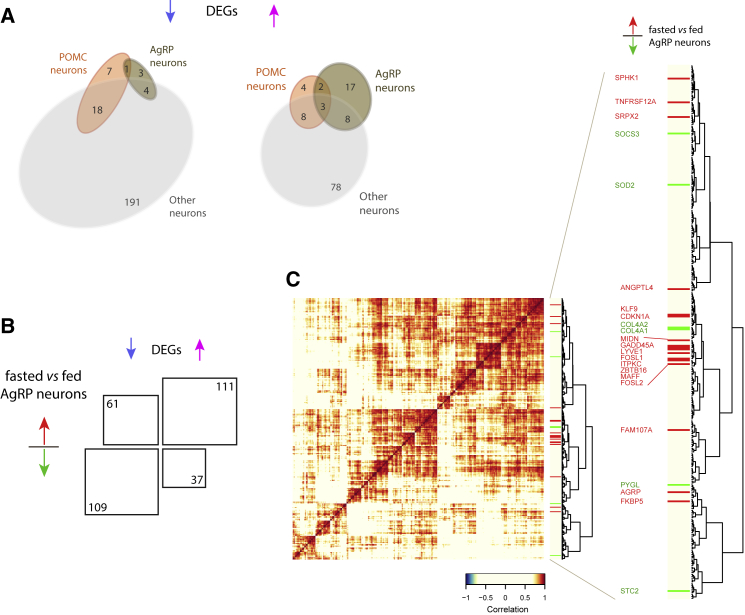
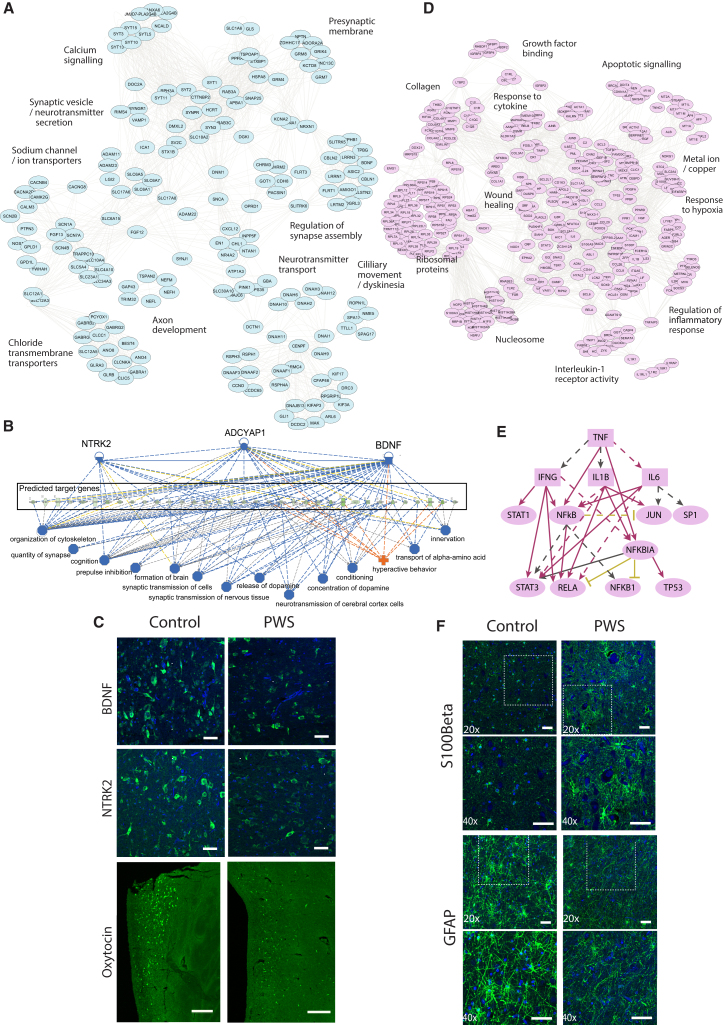
Transcriptional analysis of brain tissue from people with molecularly defined causes of obesity may highlight disease mechanisms and therapeutic targets. We performed RNA sequencing of hypothalamus from individuals with Prader-Willi syndrome (PWS), a genetic obesity syndrome characterized by severe hyperphagia. We found that upregulated genes overlap with the transcriptome of mouse Agrp neurons that signal hunger, while downregulated genes overlap with the expression profile of Pomc neurons activated by feeding. Downregulated genes are expressed mainly in neuronal cells and contribute to neurogenesis, neurotransmitter release, and synaptic plasticity, while upregulated, predominantly microglial genes are involved in inflammatory responses. This transcriptional signature may be mediated by reduced brain-derived neurotrophic factor expression. Additionally, we implicate disruption of alternative splicing as a potential molecular mechanism underlying neuronal dysfunction in PWS. Transcriptomic analysis of the human hypothalamus may identify neural mechanisms involved in energy homeostasis and potential therapeutic targets for weight loss.

Keywords: Agrp; BDNF; Prader-Willi syndrome; SNORD116; hypothalamus; obesity.


Figures

None
Graphical abstract
Figure 1
Figure 1
Genome-wide Transcriptional Changes in PWS Hypothalamus (A) Principal-component (PC) analysis showing segregation of PWS and control hypothalamic samples. (B) Heatmap representing the top 45 most significantly DEGs shown as within-gene Z score (left) and rlog-normalized read counts (right). (C) Venn diagrams illustrating differentially down- and upregulated genes in PWS versus control samples in this study (discovery set) and overlap with genes from a previous study in PWS (replication set) (Falaleeva et al., 2015). (D) Heatmaps representing the expression of brain cell-type-specific genes among the DEGs displayed as within-gene Z score of rlog-normalized read counts. See also Figure S1 and Table S1.
Figure 2
Figure 2
Dysregulated Gene Co-expression Modules in PWS Hypothalamus Converge with Fasting and Feeding Responses in Specific Hypothalamic Cell Types from Mice (A) Venn diagrams illustrating the number of DEGs that are down- and upregulated in PWS hypothalami compared with controls and their expression in Pomc, Agrp, and other neurons (Campbell et al., 2017, Henry et al., 2015). For comparison, the reference gene sets (Pomc, 261 genes; Agrp, 167 genes; other neurons, 1,589 genes) are included in Figure S2A. (B) Number of PWS DEGs (up- or downregulated) that are expressed in Agrp neurons in the fasted versus fed state (q < 0.05 in Henry et al., 2015). (C) Gene co-expression modules among upregulated PWS DEGs. Hierarchical clustering of DEGs upregulated in PWS with log2 fold change >1.5. The heatmap illustrates pairwise gene-gene correlation clustering (Pearson correlation, distance = 1-cor, Ward clustering). The sidebar (right) displays the overlap with genes previously reported upregulated (red) or downregulated (green) in Agrp neurons in the fasted versus fed state (q < 0.05 in Henry et al., 2015). See also Figure S2 and Table S1.
Figure 3
Figure 3
Pathways Predicted to Be Affected by Changes in Gene Expression Seen in PWS Hypothalamus (A) A gene annotation network illustrating terms (Gene Ontology, Reactome, Key) enriched among downregulated DEGs. Nodes represent downregulated DEGs annotated with illustrated terms; edges join pairs of genes annotated with the respective term. (B) Ingenuity Pathway Analysis (IPA) regulator effects analysis indicates the inhibition of regulatory factors NTRK2, ADCYAP1, and BDNF (top) with predicted effects on target genes and processes. Phenotypes predicted to occur as a consequence of the gene expression changes are shown in blue (inhibited) or orange (enhanced). (C) Representative FISH images of BDNF and NTRK2 mRNA-expressing cells in the ventromedial nucleus of the hypothalamus and oxytocin mRNA-expressing cells in the paraventricular nucleus of the hypothalamus in PWS and control samples (BDNF [n = 2 PWS, n = 2 controls], NTRK2 [n = 2 PWS, n = 1 control], and oxytocin [n = 2 PWS, n = 1 control]). (D) A gene annotation network illustrating terms enriched among upregulated DEGs. Nodes and edges as in Figure 2A. (E) IPA upstream regulator analysis indicates inhibition of TNF/NFKb signaling. (F) Representative immunohistochemistry images of S100Beta- and GFAP-immunoreactive cells in the ventromedial nucleus of the hypothalamus in PWS and control samples. See also Figure S3 and Table S2.
Figure 4
Figure 4
Deletion of SNORD116 Impairs Neuronal Differentiation, Proliferation, and Survival (A) Targeted deletion of SNORD116 (SNORD116del) affects the neuronal differentiation of SH-SY5Y cells, cultured for 7 days in retinoic acid (RA) in the absence (n = 5) or presence (n = 3) of BDNF. Left: representative images of wild-type (WT) and SNORD116del cells; right: quantification plot. (B) Cellular proliferation measured by EdU incorporation at day 7 (n = 3). (C) Cell survival measured by FACS at day 7 in culture (n = 6). (D) Overlap between in silico predicted SNORD116 gene targets and PWS differentially expressed and differentially spliced genes. All data are presented as mean ± SEM. Statistical significance was measured using two-tailed Student’s t test (p < 0.05, ∗∗p < 0.01, ∗∗∗p < 0.001; ns, non-significance). See also Figure S4 and Tables S3 and S4.

References

    1. Andermann M.L., Lowell B.B. Toward a wiring diagram understanding of appetite control. Neuron. 2017;95:757–778. - PMC - PubMed
    1. Arbab M., Srinivasan S., Hashimoto T., Geijsen N., Sherwood R.I. Cloning-free CRISPR. Stem Cell Reports. 2015;5:908–917. - PMC - PubMed
    1. Atasoy D., Betley J.N., Su H.H., Sternson S.M. Deconstruction of a neural circuit for hunger. Nature. 2012;488:172–177. - PMC - PubMed
    1. Barres B.A. The mystery and magic of glia: a perspective on their roles in health and disease. Neuron. 2008;60:430–440. - PubMed
    1. Bazeley P.S., Shepelev V., Talebizadeh Z., Butler M.G., Fedorova L., Filatov V., Fedorov A. snoTARGET shows that human orphan snoRNA targets locate close to alternative splice junctions. Gene. 2008;408:172–179. - PMC - PubMed

Publication types

MeSH terms

Substances