. 2018 Mar 27;22(13):3416-3426.
doi: 10.1016/j.celrep.2018.03.014.

A Conserved Circadian Function for the Neurofibromatosis 1 Gene

Affiliations

A Conserved Circadian Function for the Neurofibromatosis 1 Gene

Lei Bai et al. Cell Rep. .

Abstract

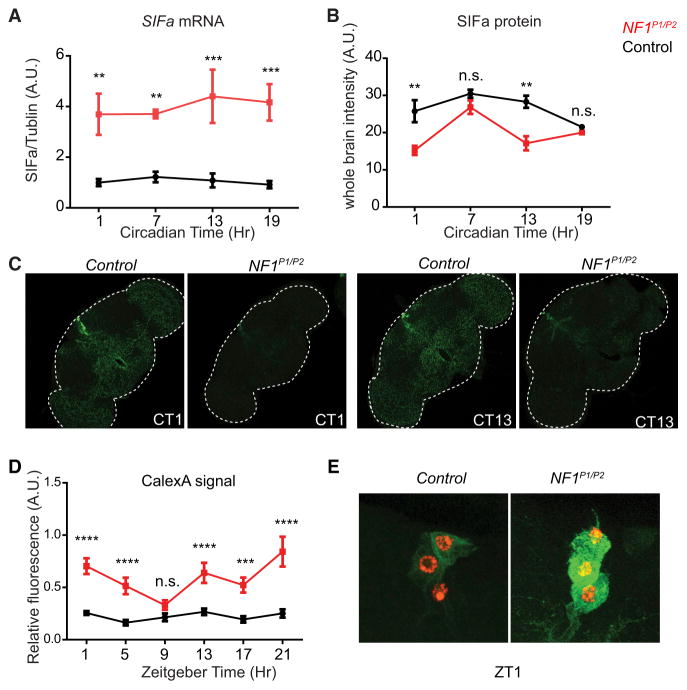
Loss of the Neurofibromatosis 1 (Nf1) protein, neurofibromin, in Drosophila disrupts circadian rhythms of locomotor activity without impairing central clock function, suggesting effects downstream of the clock. However, the relevant cellular mechanisms are not known. Leveraging the discovery of output circuits for locomotor rhythms, we dissected cellular actions of neurofibromin in recently identified substrates. Herein, we show that neurofibromin affects the levels and cycling of calcium in multiple circadian peptidergic neurons. A prominent site of action is the pars intercerebralis (PI), the fly equivalent of the hypothalamus, with cell-autonomous effects of Nf1 in PI cells that secrete DH44. Nf1 interacts genetically with peptide signaling to affect circadian behavior. We extended these studies to mammals to demonstrate that mouse astrocytes exhibit a 24-hr rhythm of calcium levels, which is also attenuated by lack of neurofibromin. These findings establish a conserved role for neurofibromin in intracellular signaling rhythms within the nervous system.

Keywords: Drosophila; circadian rhythms; cycling of calcium; mouse astrocytes; neurofibromatosis 1; peptide signaling.


Conflict of interest statement

DECLARATION OF INTERESTS

The authors declare no competing interests.

Figures

Figure 1
Figure 1. PDF Accumulation Is Reduced in the Dorsal Brain in Nf1 Mutants
(A) Schematic drawing of the fly brain showing the circadian circuit for locomotor rhythms, which includes the master pacemaker s-LNvs (magenta), DN1 clock cells (green), and DH44+ (cyan) and SIFa+ (yellow) cells in the PI. The dashed box shows the region of the dorsal brain imaged in (B). (B) PDF staining in the dorsal termini of s-LNvs at CT1 and CT13 in iso31 and Nf1P1/P2 mutant flies. CT, circadian time. Representative images are shown in the top panel. Quantification of average staining intensity (mean ± SEM) is shown in the bottom panel. ****p < 0.0001, *p < 0.05 (one-way ANOVA and Tukey’s multiple comparison test). n = 14 brains for iso31 CT1, iso31 CT13, and Nf1 CT1, and n = 11 brains for Nf1 CT13. See Figure S2 for analysis of DN1 neurons.
Figure 2
Figure 2. Neurofibromin Has Cell-Autonomous Effects on Rhythms of Neural Activity in DH44+ PI Neurons
(A) DH44 expression was not significantly different between iso31 and Nf1P1/P2 mutants. The bar graph shows mean ± SEM. n = 5 for iso31, and n = 6 for Nf1P1/P2. (B) Normalized fluorescence from calcium-dependent GFP expression in DH44-GAL4 > CaLexA/RedStinger flies. The complete genotypes are as follows: control: UAS-RedStinger, lexAop2-mCD8::GFP/DH44-G4; UAS-mLEXA-VP16-NFAT, LexAop-CD2-GFP/+. Nf1P1/P2: UAS-RedStinger, lexAop2-mCD8::GFP/DH44-G4; UAS-mLEXA-VP16-NFAT, LexAop-CD2-GFP, Nf1P1/Nf1P2. Although CaLexA GFP signals in DH44 neurons were not significantly different between control and Nf1P1/P2 flies at either the ZT1 or the ZT13 time point, there was a significant difference in fluorescence intensity between ZT1 and ZT13 in control flies (****p < 0.0001) that was not observed in Nf1P1/P2 flies (one-way ANOVA and Tukey’s multiple comparison test). n = 24–42 cells. (C) Expression of transgenic Nf1 in DH44 cells of Nf1 mutant flies rescues cycling of calcium. Fluorescence from the CaLexA reporter in DH44 cells was normalized to the mean background intensity of the brain in Nf1 mutants expressing Nf1 in DH44 cells (UAS-RedStinger, lexAop2-mCD8::GFP/+; UAS-mLEXA-VP16-NFAT, LexAop-CD2-GFP, Nf1P1/DH44-Gal4, UAS-Nf1, Nf1P1) and in controls that lacked UAS-Nf1 (UAS-RedStinger, lexAop2-mCD8::GFP/+; UAS-mLEXA-VP16-NFAT, LexAop-CD2-GFP, Nf1P1/DH44-Gal4, Nf1P1). JTK_CYCLE indicated a rhythm in rescued flies. n = 15–26 cells from 4–7 brains per time point.
Figure 3
Figure 3. Expression of SIFa and Calcium Oscillations of SIFa+ PI Neurons Are Altered in Nf1P1/P2 Mutant Flies
(A) SIFa mRNA levels throughout the day, normalized to α-tublin, in Nf1P1/P2 mutants (red) and control iso31 (black) flies. Comparisons were with two-way ANOVA and Tukey post hoc test. **p < 0.01, ***p < 0.001. n = 5 independent experiments. Error bars represent SEM. (B) SIFa staining intensity averaged over the whole brain in Nf1P1/P2 mutants (red) and control iso31 (black) flies. Comparisons were with two-way ANOVA and Tukey post hoc test. **p < 0.01, n.s., not significant. n = 36–48 cells each. Error bars represent SEM. (C) Representative images of SIFa brain staining. The white dashed lines outline the brains. (D) Normalized fluorescence from expression of the CaLexA reporter in SIFa neurons. The complete genotypes are as follows: control (black): UAS-RedStinger, lexAop2-mCD8::GFP/ SIFa-G4; UAS-mLEXA-VP16-NFAT/+. Nf1P1/P2 (red): UAS-RedStinger, lexAop2-mCD8::GFP/ SIFa-G4; UAS-mLEXA-VP16-NFAT, Nf1P1/Nf1P2. Two-way ANOVA and Tukey’s test. ***p < 0.001, ****p < 0.0001; n.s., not significant. n = 24–44 cells each. Error bars represent SEM. (E) Representative images of the CaLexA GFP signal in SIFa neurons. See also Figure S3.
Figure 4
Figure 4. Genetic Ablation of Nf1 Upregulates Calcium Levels and Disrupts Calcium Oscillations in Mammalian Astrocytes
(A) Fluorescence images of a time course of changes in calcium in wild-type (control) and Nf1−/− (MUT) astrocytes after dexamethasone stimulation. Images were taken at low magnification (40×) using a FITC filter set (474 nm excitation and 530 nm emission). Scale bar, 50 μm. See Figures S4A and S4B for detailed experimental procedures and higher-magnification images. (B and C) Quantitative measurement of calcium changes in ten wild-type (control) astrocytes (B) or Nf1−/− (MUT) astrocytes (C) at the time points indicated. The results are plotted as line graphs. See Figure S4C for details of quantitative calcium measurements in single cells. (D) Quantitative comparison of changes of calcium levels over time in wild-type (control) and mutant (MUT) astrocytes. Error bars represent SD of the mean. **p < 0.05, ***p < 0.0005. Figure S4D provides statistical analysis of time-of-day effects, using JTK_CYCLE and Lomb-Scargle algorithms.

References

    1. Anastasaki C, Woo AS, Messiaen LM, Gutmann DH. Elucidating the impact of neurofibromatosis-1 germline mutations on neurofibromin function and dopamine-based learning. Hum Mol Genet. 2015;24:3518–3528. - PMC - PubMed
    1. Artiushin G, Sehgal A. The Drosophila circuitry of sleep-wake regulation. Curr Opin Neurobiol. 2017;44:243–250. - PMC - PubMed
    1. Bai L, Sehgal A. anaplastic lymphoma kinase acts in the Drosophila mushroom body to negatively regulate sleep. PLoS Genet. 2015;11:e1005611. - PMC - PubMed
    1. Balsalobre A, Brown SA, Marcacci L, Tronche F, Kellendonk C, Reichardt HM, Schütz G, Schibler U. Resetting of circadian time in peripheral tissues by glucocorticoid signaling. Science. 2000;289:2344–2347. - PubMed
    1. Barber AF, Erion R, Holmes TC, Sehgal A. Circadian and feeding cues integrate to drive rhythms of physiology in Drosophila insulin-producing cells. Genes Dev. 2016;30:2596–2606. - PMC - PubMed

Publication types