. 2018 Mar 28;19(1):44.
doi: 10.1186/s13059-018-1415-3.

Discovery of physiological and cancer-related regulators of 3' UTR processing with KAPAC

Affiliations

Discovery of physiological and cancer-related regulators of 3' UTR processing with KAPAC

Andreas J Gruber et al. Genome Biol. .

Abstract

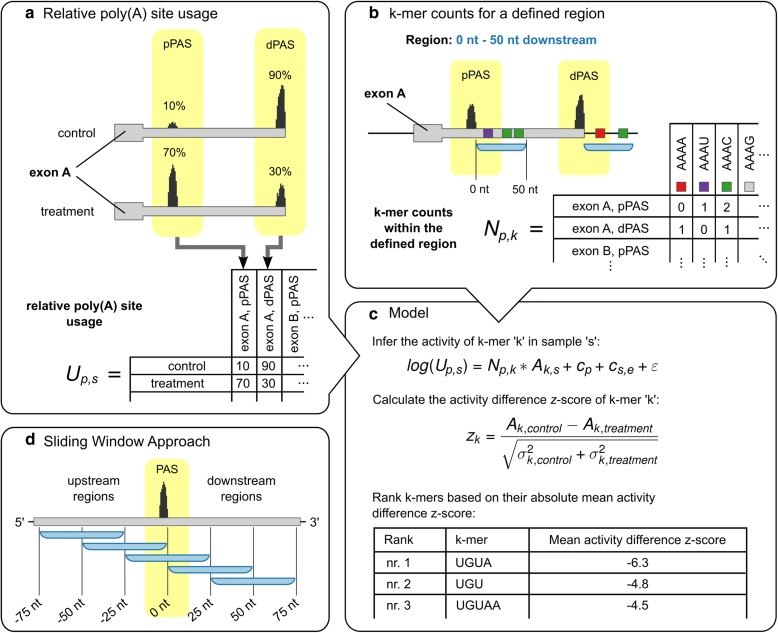
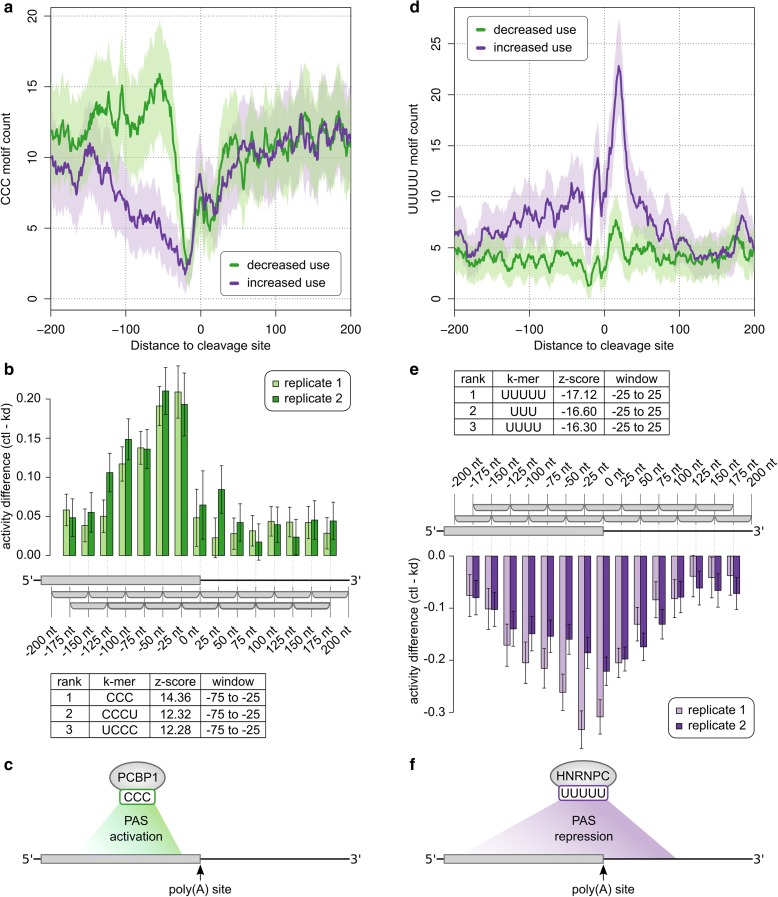
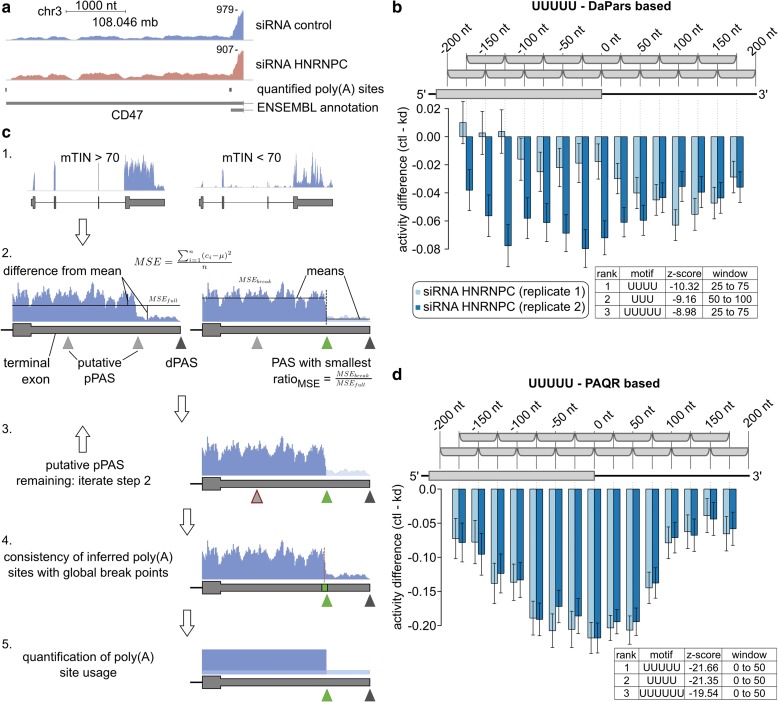
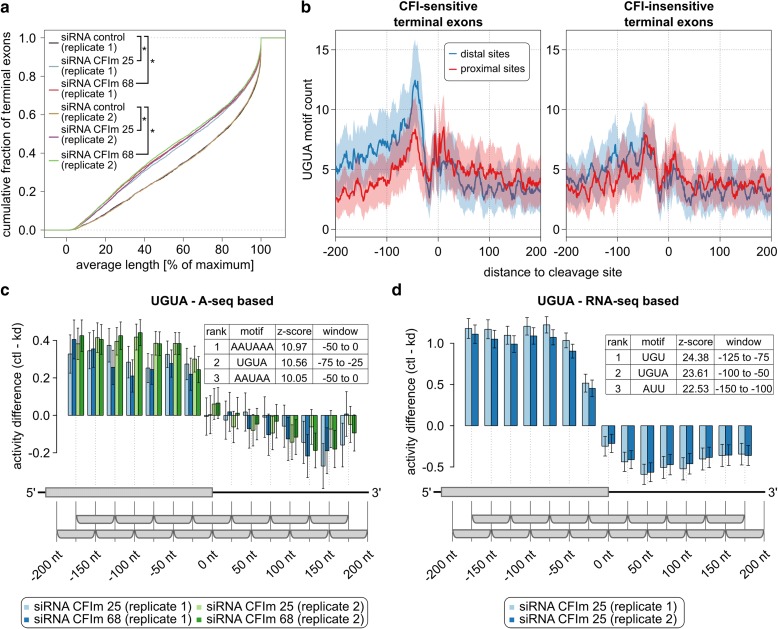
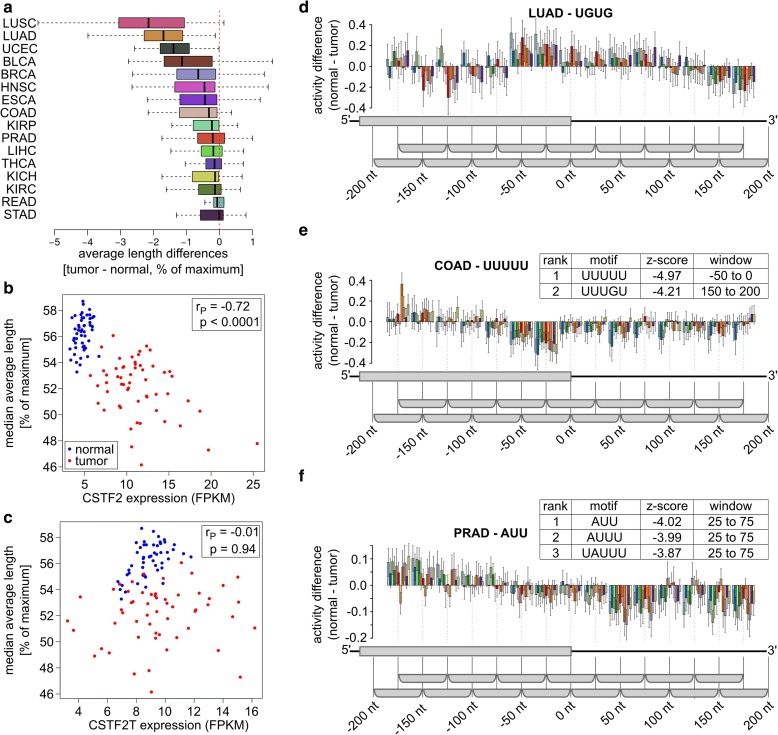
3' Untranslated regions (3' UTRs) length is regulated in relation to cellular state. To uncover key regulators of poly(A) site use in specific conditions, we have developed PAQR, a method for quantifying poly(A) site use from RNA sequencing data and KAPAC, an approach that infers activities of oligomeric sequence motifs on poly(A) site choice. Application of PAQR and KAPAC to RNA sequencing data from normal and tumor tissue samples uncovers motifs that can explain changes in cleavage and polyadenylation in specific cancers. In particular, our analysis points to polypyrimidine tract binding protein 1 as a regulator of poly(A) site choice in glioblastoma.

Keywords: APA; CFIm; Cleavage and polyadenylation; Colon adenocarcinoma; Glioblastoma; HNRNPC; KAPAC; PAQR; PTBP1; Prostate adenocarcinoma.


Conflict of interest statement

Ethics approval and consent to participate

Authorization to use RNA-seq data from patient samples, which is obtained by TCGA Research Network, has been granted.

Competing interests

The authors declare that they have no competing interests.

Publisher’s Note

Springer Nature remains neutral with regard to jurisdictional claims in published maps and institutional affiliations.

Figures

Fig. 1
Fig. 1
Schematic outline of the KAPAC approach. a Tabulation of the relative usage of poly(A) sites in different experimental conditions (here, control and treatment). b Tabulation of k-mer counts for regions (blue) located at a defined distance with respect to poly(A) sites p. c Based on the usage of poly(A) sites relative to the mean across samples and the counts of k-mers k in windows located at specific distances from the poly(A) sites p, KAPAC infers activities Ak,s of k-mers in samples s. cs,e is the mean relative usage of poly(A) sites from exon e in sample s, cp is the mean log2-relative usage of poly(A) site p across samples, and ε is the residual error. KAPAC ranks k-mers based on the absolute z-score of the mean activity difference in two conditions (here, in control relative to treatment). d Fitting the KAPAC model for windows located at specific distances relative to poly(A) sites, position-dependent activities of sequence motifs on poly(A) site use are inferred
Fig. 2
Fig. 2
KAPAC accurately uncovers the activity of known regulators of poly(A) site choice. a Smoothened (± 5 nt) density of non-overlapping (C)3 motifs in the vicinity of poly(A) sites that are consistently processed (increased or decreased use) in two PCBP1 knock-down experiments from which 3′ end sequencing data are available [23]. Shaded areas indicate standard deviations based on binomial sampling. b Difference of (C)3 motif activity inferred by KAPAC in the two replicates of control (Ctrl) versus PCBP1 knock-down (KD) experiments (number of PAS n = 3737). The positive differences indicate that (C)3 motifs are associated with increased PAS use in control samples. The table shows the three most significant motifs, with the z-score and position of the window from which they were inferred. c Model of the KAPAC-inferred impact of PCBP1 on CPA. d Smoothened (± 5 nt) density of non-overlapping (U)5 tracts in the vicinity of sites that are consistently processed (increased or decreased use) in two HNRNPC knock-down experiments [29]. e Difference of (U)5 motif activity inferred by KAPAC in the two replicates of control (Ctrl) versus HNRNPC knock-down (KD) experiments (n = 4703). The negative differences indicate that (U)5 motifs are associated with decreased PAS use in the control samples. The table with the three most significant motifs is also shown, as in b. f Model of the KAPAC-inferred impact of HNRNPC on CPA
Fig. 3
Fig. 3
Overview of PAQR. a Read coverage profile of the CD47 terminal exon, whose processing is affected by the knock-down of HNRNPC [19]. b KAPAC-inferred position-dependent activities of the (U)5 motif based on DaPars-based estimates of relative PAS use (number of PAS n = 13,388) in the same data set as in a. c Sketch of PAQR. 1) Samples with highly biased read coverage along transcripts (low mTIN score), presumably affected by RNA degradation, are identified and excluded from the analysis. 2) Usage of proximal PAS (pPAS) in a sample is determined based on the expected drop in coverage downstream of the used PAS (ratio of the mean squared deviation from mean coverage (MSE) in the full region compared to two distinct regions, split by the poly(A) site). 3) Step 2 is repeated iteratively for subregions bounded by already determined PAS. 4) The consistency between PAS called as used and the global best break points in corresponding regions is evaluated and in case of discrepancy, terminal exons are discarded from the analysis. 5) Relative PAS use is calculated from the average read coverage of individual 3′ UTR segments, each corresponding to the terminal region of an isoform that ends at a used poly(A) site. d Similar HNRNPC activity on PAS use is inferred by KAPAC from estimates of PAS use generated either by PAQR from RNA sequencing data (n = 3599), or measured directly by 3′ end sequencing (Fig. 2e)
Fig. 4
Fig. 4
Position-dependent activation of pre-mRNA processing by CFIm. a The distributions of average terminal exon lengths (see “Methods”) computed from 5123 multi-PAS terminal exons quantified in CFIm 25, CFIm 68 knock-down, and control samples indicate significant shortening of 3′ UTRs upon CFIm depletion (asterisks indicate two-sided Wilcoxon signed-rank test p value < 0.0001). b Smoothened (± 5 nt) UGUA motif density around PAS of terminal exons with exactly two quantified poly(A) sites, grouped according to the log fold change of the proximal/distal ratio (p/d ratio) upon CFIm knock-down. The left panel shows the UGUA motif frequency around the proximal and distal PAS of the 750 exons with the largest change in p/d ratio, while the right panel shows similar profiles for the 750 exons with the smallest change in p/d ratio. c KAPAC analysis of CFIm knock-down and control samples uncovers the poly(A) signal and UGUA motif as most significantly associated with changes in PAS usage (n = 3727). d UGUA motif activity is similar when the PAS quantification is done by PAQR from RNA sequencing data of CFIm 25 knock-down and control cells (n = 4287) [11]
Fig. 5
Fig. 5
Regulation of PAS choice in glioblastoma samples from TCGA. a Cumulative distributions of weighted average length of 1172 terminal exons inferred by applying PAQR to five normal and five tumor samples (see “Methods” for the selection of these samples) show that terminal exons are significantly shortened in tumors. b Activity profile of CUCUCU, the second most significant motif associated with 3′ end processing changes in glioblastoma (number of PAS used in the inference n = 2119). The presence of the motif in a window from −25 to +75 relative to PAS is associated with increased processing of the site in normal tissue samples. c Expression of PTBP1 in the ten samples from a is strongly anti-correlated (dark colored points; Pearson’s r (rP) = −0.97, p value < 0.0001) with the median average length of terminal exons in these samples. In contrast, the expression of PTBP2 changes little in tumors compared to normal tissue samples, and has a positive correlation with terminal exon length (light colored points; rP = 0.85, p value = 0.002). d Position-dependent PTBP1 binding inferred from two eCLIP studies (in HepG2 (thick red line) and K562 (thick blue line) cell lines) by the ENCODE consortium is significantly enriched downstream of the 203 PAS predicted to be regulated by the CU-repeat motifs. We selected 1000 similar-sized sets of poly(A) sites with the same positional preference (distally located) as the targets of the CU motif and the density of PTBP1 eCLIP reads was computed as described in the “Methods” section. The mean and standard deviation of position-dependent read density ratios from these randomized data sets are also shown. e The median ratio of PTBP1-IP to background eCLIP reads over nucleotides 0 to 100 downstream of the PAS (position-wise ratios computed as in e), for the top 102 (top) and bottom 101 (low) predicted PTBP1 targets as well as for the background set (bg) of distal PAS. f Activity profile of the same CUCUCU motif in the PTBP1/2 double knock-down (where the motif ranked third) compared to control samples (two biological replicates from HEK cells, number of PAS n = 2493)
Fig. 6
Fig. 6
Analysis of TCGA data sets. a For TCGA data sets with at least five matching normal–tumor pairs with high RNA integrity (mTIN > 70), the distributions of patient-wise medians of tumor–normal tissue differences in average terminal exon lengths are shown. Except for adenocarcinoma of the stomach (STAD), the median is negative for all cancers, indicating global shortening of 3′ UTRs in tumors. b Among 56 matching lung adenocarcinoma (LUAD)-normal tissue pairs (from 51 patients) where global shortening of terminal exons was observed, the CSTF2 expression (in fragments per kilobase per million (FPKM)) was negatively correlated (rP = −0.72, p value = 2.5e-18) with the median of average exon length. c For the same samples as in b, no significant correlation (rP = −0.01, p value = 0.89) between the expression of CSTF2T and the median of average exon length was observed. d Activity profile of the UGUG CSTF2-binding motif inferred from matched LUAD tumor–normal tissue sample pairs (n = 1054). For visibility, ten randomly selected sample pairs are shown instead of all 56. e, f Activity profiles of UUUUU and AUU, the motifs most significantly associated by KAPAC with changes in PAS use in colon adenocarcinoma (COAD; number of PAS n = 1294) (e) and prostate adenocarcinoma (PRAD; number of PAS n = 1835) (f), respectively (11 tumor–normal tissue sample pairs in both studies)

References

    1. Wahle E, Rüegsegger U. 3′-d processing of pre-mRNA in eukaryotes. FEMS Microbiol Rev. 1999;23:277–295. doi: 10.1111/j.1574-6976.1999.tb00400.x. - DOI - PubMed
    1. Proudfoot NJ. Ending the message: poly(A) signals then and now. Genes Dev. 2011;25:1770–1782. doi: 10.1101/gad.17268411. - DOI - PMC - PubMed
    1. Gruber AR, Martin G, Keller W, Zavolan M. Means to an end: mechanisms of alternative polyadenylation of messenger RNA precursors. Wiley Interdiscip Rev RNA. 2014;5:183–196. doi: 10.1002/wrna.1206. - DOI - PMC - PubMed
    1. Tian B, Manley JL. Alternative polyadenylation of mRNA precursors. Nat Rev Mol Cell Biol. 2017;18:18–30. doi: 10.1038/nrm.2016.116. - DOI - PMC - PubMed
    1. Martin G, Gruber AR, Keller W, Zavolan M. Genome-wide analysis of pre-mRNA 3′ end processing reveals a decisive role of human cleavage factor I in the regulation of 3′ UTR length. Cell Rep. 2012;1:753–763. doi: 10.1016/j.celrep.2012.05.003. - DOI - PubMed

Publication types

MeSH terms

Substances

LinkOut - more resources