. 2018 May 1;200(9):3231-3243.
doi: 10.4049/jimmunol.1701500. Epub 2018 Mar 28.

Single Degranulations in NK Cells Can Mediate Target Cell Killing

Affiliations

Single Degranulations in NK Cells Can Mediate Target Cell Killing

Lavesh A Gwalani et al. J Immunol. .

Abstract

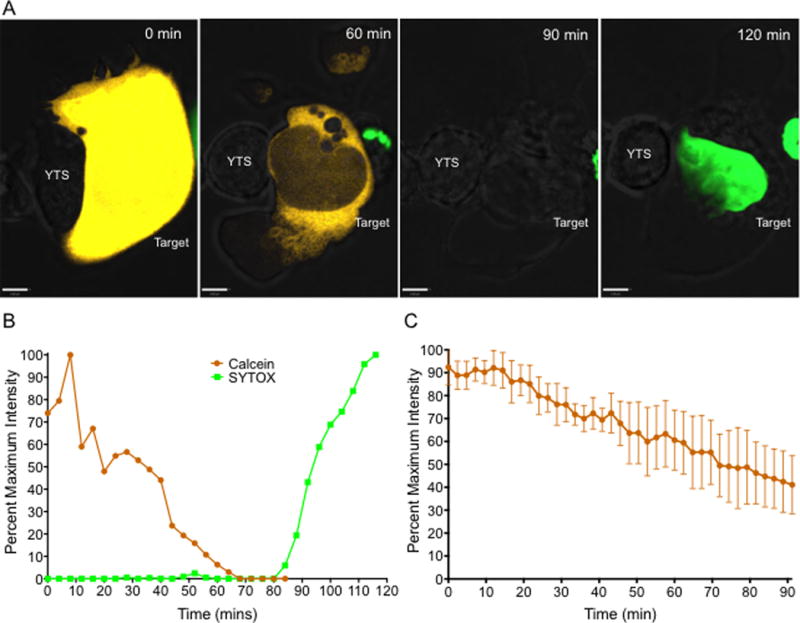
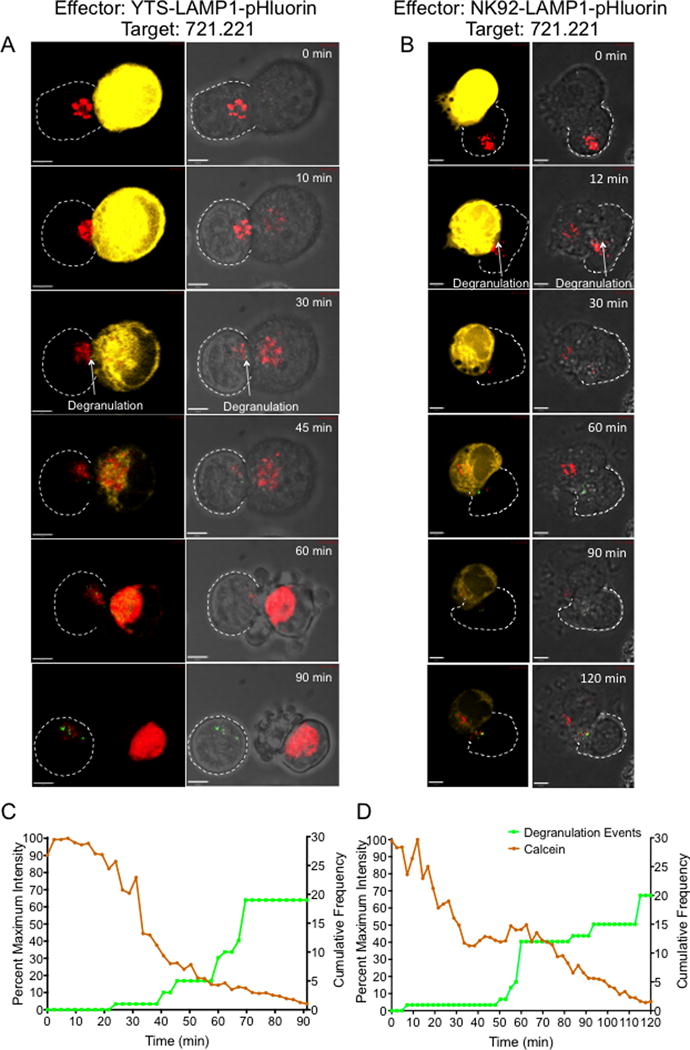
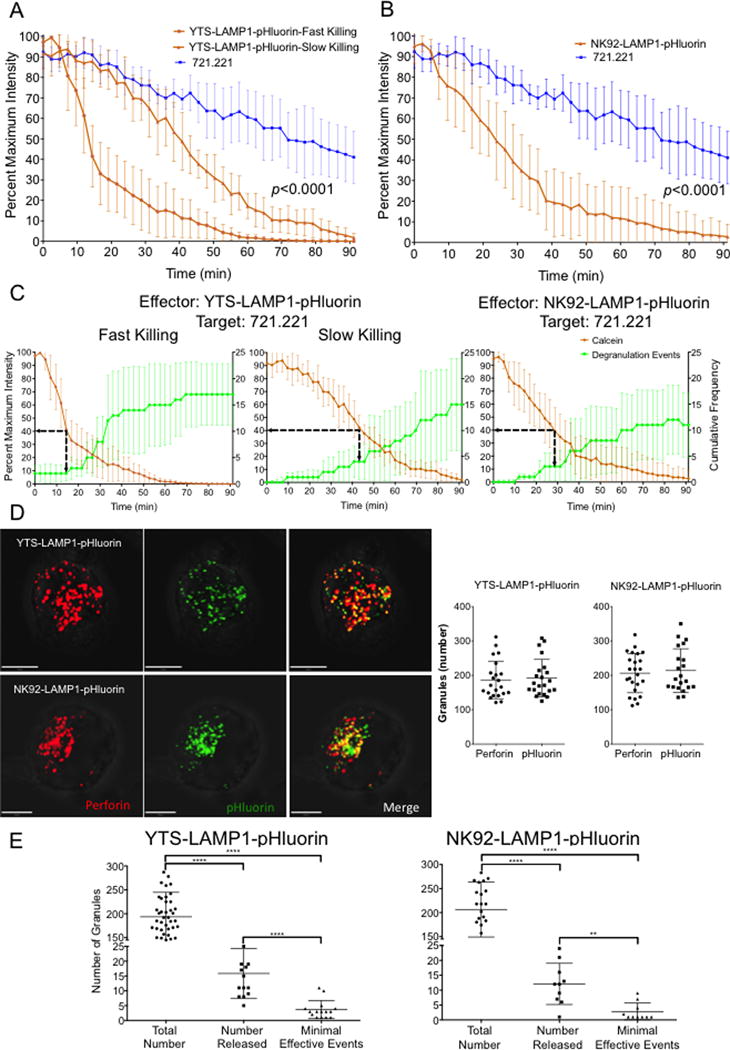
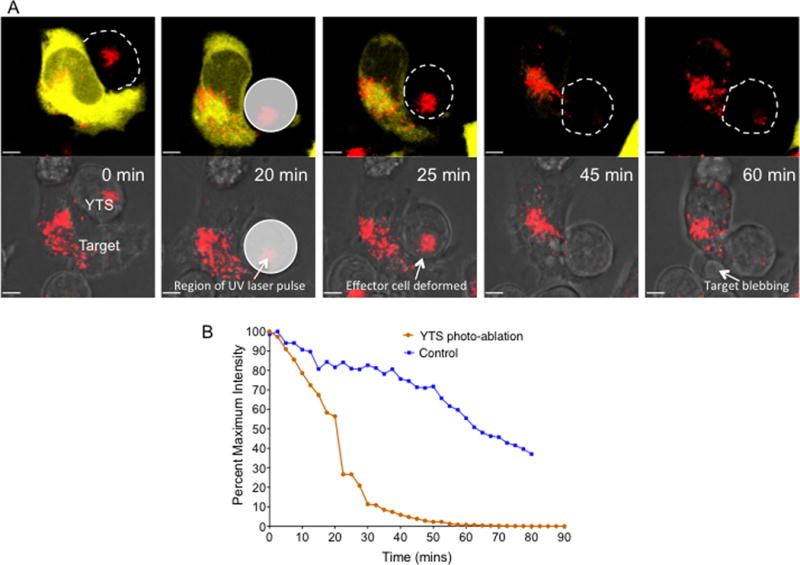
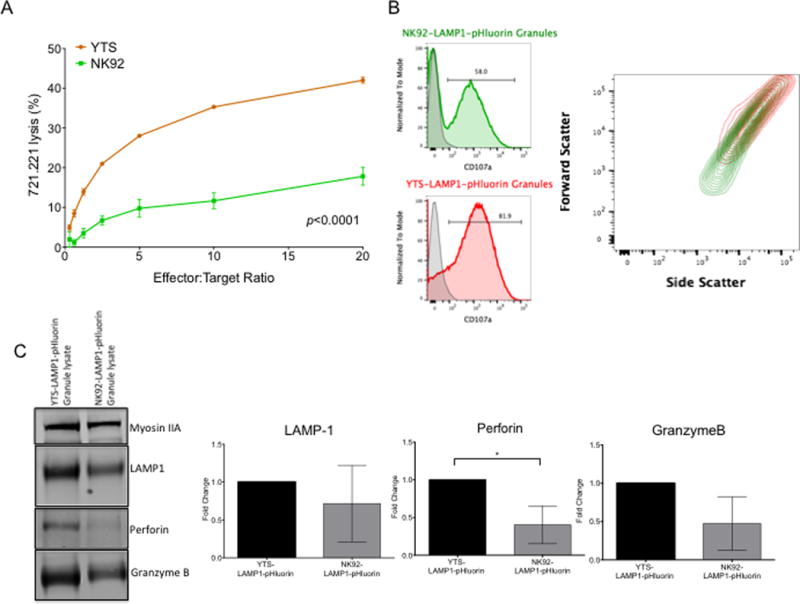
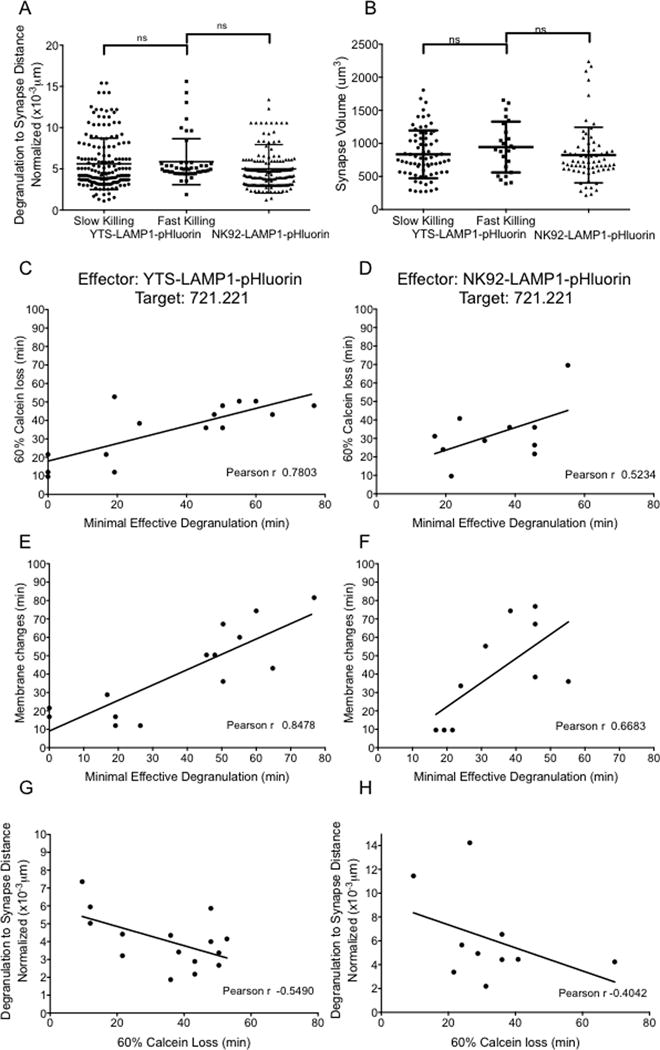
NK cells are cytotoxic lymphocytes important in defense against viral infection and cancer. NK cells mediate cytotoxicity predominantly through directed secretion of lytic granules, which are specialized lysosome-related organelles, containing effector molecules such as perforin and granzymes. Although many requirements for lytic granule transport to, and secretion at, the NK cell lytic synapse are known, the minimum number of degranulation events required by an NK cell to kill its target is unknown. We performed high-resolution four-dimensional confocal microscopy of human NK-target cell conjugates to quantify NK cell degranulation (using a degranulation indicator, LAMP-1-pHluorin) as well as target cell death. Despite containing almost 200 granules, we found that an individual NK cell needed only two to four degranulation events, on average, to mediate target cell death. Although NK cells released approximately one-tenth of their total lytic granule reserve upon a single target, they required just over one-hundredth of their total lytic granules to kill a target cell. Importantly, the kinetics of NK cell killing correlated to the size of and the amount of effector molecules contained within lytic granules, as well as the temporal, but not spatial, organization of degranulation events. Thus, our study answers a fundamental question as to how many degranulation events it takes for a human NK cell to kill its target.


Figures

Figure 1
Figure 1. Loss of calcein fluorescence is an early indicator of target cell death
(A and B) YTS effector cells were incubated with calcein, orange-red labeled 721.221 target cells (yellow) in the presence of SYTOX Green nucleic acid stain (green). Z stack images of single cell YTS-721.221 conjugates were acquired by confocal microscopy. Imaging was performed at a frame rate of one image every 4 minutes for 120 minutes to 180 minutes until target cell death was observed. (A) Representative maximum projection time-lapse images of the YTS-721.221 conjugate. Scale bar 5μm. Target cell death was detected either through loss of calcein from the target cell or through entry of SYTOX Green in to the target cell. (B) Quantitative analysis of calcein and SYTOX Green fluorescence in the 721.221 target cell from the representative live cell cytotoxicity assay shown in (A). Values are percentage of maximum fluorescence intensity of the dyes in the target cell during the imaging time frame. Results are representative of at least 5 independent experiments. (C) Quantitative analysis of loss of calcein fluorescence in 721.221 target cells incubated without NK cells. Analyses shown are from 6 independent experiments (n=9). Data are represented as mean +/− standard deviation (SD).
Figure 2
Figure 2. Live single-cell cytotoxicity for visualization and measurement of target cell killing by NK cells
LAMP1-pHluorin transduced YTS and NK92 (effector) cells were loaded with LysoTracker Deep Red (red) and incubated with calcein, AM orange-red labeled 721.221 target cells (yellow). Z-stack images of single cell conjugates were acquired by confocal microscopy. Even though the 721.221 target cells were not stained with LysoTracker™ Deep Red, the excess dye from effector cells that leaked in to the medium was taken up by the target cell and the accumulation in the target cell increased once the membrane integrity was lost. Imaging was performed at a frame rate of 1 image every 2.4 minutes for 90 to 120 minutes until target cell death was observed. Representative maximum projection time-lapse image sequences of a single YTS cell (A) and a NK92 cell (B) conjugated to a single 721.221 target cell. Left panel shows calcein fluorescence (yellow) and degranulation events (green) at the NK-target cell synapse. Right panels show bright field images of the conjugates showing degranulation events (green) and characteristic apoptotic membrane blebbing in the target cell. The synaptic region of interest were selected as the overlapping region between the NK and the target cell identified in bright field images. Scale bar 5μm. (C and D) Quantitative analysis of degranulation and calcein fluorescence in the representative YTS-721.221 conjugate (C) and NK92-721.221 conjugate (D). Cumulative frequency of degranulation events in the effector cells and the fluorescence intensity of calcein in the target cell (calculated as a percent of maximum fluorescence intensity) were plotted against imaging time. Images and analyses are representative of 10-15 independent experiments.
Figure 3
Figure 3. Quantitative analysis of degranulation during NK cell mediated killing of target cells in live single cell cytotoxicity assays
(A) Analysis of calcein fluorescence in 721.221 target cells conjugated to YTS cells showed either a slow release or a fast release pattern. Both curves were significantly different from each other. (B) Analysis of calcein fluorescence in 721.221 target cells conjugated to NK92 cells showed a single pattern of calcein release. In both (A) and (B) loss of calcein fluorescence from 721.221 cells conjugated to NK effector cells were significantly different from loss of calcein fluorescence seen in 721.221 cells incubated without effector cells (data from Figure 1C). Statistical analysis was done by log transformation of the mean fluorescence data, linear regression analysis of the transformed data and comparison of slopes; p<0.0001 for all comparisons. (C) Average minimal effective degranulation events for cytotoxicity were determined for the different patterns of killing observed. Minimal effective degranulation was defined as the number of degranulation events in the effector cells corresponding to 60% loss of calcein fluorescence in target cells (dashed arrow). Data from A, B and C are represented as mean values +/− SD. Data are from 5 to 15 independent experiments in each group. (D) Representative extended focus confocal images and quantitative analysis of the total number of granules in LAMP1-pHluorin transduced YTS and NK92 NK cell lines. Lytic granules were counted either using the perforin signal or the LAMP-1-pHluorin signal. (E) Total number of lytic granules (determined using perforin staining), the number of lytic granules released in the synaptic region during live cell imaging and the minimal effective degranulation events needed for cytotoxicity against 721.221 target cells. Data are represented as mean values ± SD. Data are from 25 single cells to determine total number of granules and from 10 to 15 independent experiments to determine the number lytic granules released and minimal effective degranulation events. Statistical analysis were done using unpaired Student’s t test to compare total number to number released and minimal effective events and paired Student’s t test to compare number released and minimal effective events. **p<0.01; ****p<0.0001.
Figure 4
Figure 4. Initial degranulations in a NK cell are sufficient to kill the target cell
YTS effector cells stained with LysoTracker™ Deep Red (red) were incubated with calcein, orange-red labeled 721.221 target cells (yellow). Z-stack images of single YTS-721.221 cell conjugates were acquired at a frame rate of one image every 2.5 minutes. UV laser pulses were applied in the region of the YTS cell for photo-ablation of the effector NK cell once the lytic granules were polarized towards the target cell and the target cell had begun to lose its calcein fluorescence. In control experiments the YTS cell was photo-ablated at an earlier time point before polarization of the lytic granules towards the IS. (A) Representative maximum projection time-lapse images of the YTS-721.221 conjugate. Top panel shows calcein fluorescence (yellow); Bottom panel shows bright field images of the conjugate with deformation of the YTS NK cell after photo-ablation and characteristic apoptotic membrane blebbing in the target cell. The translucent white circle show the boundries of the region in which the UV pulses were applied to photo-ablate the YTS cell. Scale bar 5μm. (B) Quantitative analysis of calcein fluorescence in the 721.221 target cell from the representative live cell cytotoxicity assay shown in (A) and from a control experiment in which UV laser pulses were applied to YTS cell before the lytic granules had polarized. Images and analysis is representative of at least 5 independent experiments.
Figure 5
Figure 5. Cytotoxic efficiency and lytic granule characteristics of LAMP-1-pHluorin transduced NK cell lines YTS and NK92
(A) Cytotoxic activity of YTS-LAMP-1-pHluorin and NK92-LAMP-1-pHluorin cells against their target cell line 721.221 in a 4-hour 51Cr release cytotoxicity assay. Experiments were performed in triplicates. Data represents mean +/− SEM from 3 independent experiments. (B) Lytic granules were isolated from the NK cell lines by density gradient ultracentrifugation. Isolated lytic granules were permeabilized, fixed and stained with anti-LAMP1 antibody for flow cytometry analysis. LAMP-1 positive events were gated for comparison of their relative sizes by their ability to scatter light. Overlay of forward and side scatter plots of the granules from the two cell lines showed that YTS granules (red) were relatively larger than the NK92 granules (green). (C) Western blots and densitometry analysis of lytic granule lysates from the LAMP-1-pHluorin transduced NK cell lines YTS and NK92. Densitometry values of the LAMP1, Perforin and GranzymeB bands were normalized to Myosin IIA and plotted as a proportion of effector molecule content in YTS lytic granules. Data in (B) is representative of 3 independent experiments. Data in (C) is average of 3 independent experiments, normalized to Myosin IIA, and plotted as fold change relative to YTS lytic granules Error bars represent ±SD. Statistical analysis were performed using unpaired Student’s t test of log transformed densitometry data. *p<0.05
Figure 6
Figure 6. Spatiotemporal association between degranulation and NK cell cytotoxicity
(A) Synapse to degranulation distances and synapse sizes were measured from time-lapse imaging data of YTS-721.221 and NK92-721.221 conjugates illustrated in Figure 3. Mean distances between degranulation events and the centroid of the synapse were measured at each time point of the time-lapse images until target cell death was observed. Normalization of the data was performed by dividing absolute granule to synapse distances by the size of the synapse at the respective time point. (B) Synapse sizes were measured by drawing a ROI in the region of overlap between the NK and target cells at each time point of the time-lapse images until target cell death was observed. Dots in (A) and (B) represent data from each time point of live cell imaging from 5 to 10 independent experiments in each group. Lines indicate mean values +/− SD. (C and D) Correlation between time to commitment to target cell death (defined as time point after which loss of calcein fluorescence in the target cell exceeded 60%) and time to reach minimal effective degranulation (defined as time point at which the cumulative frequency of degranulation events reached the average minimal effective level). (E and F) Correlation between membrane changes in the target cell (marked by formation of blebs observed in the bright field channel) and time to reach minimal effective degranulation events. (G and H) Correlation between average degranulation to synapse distance for each conjugate (normalized as above) and time to commitment to target cell death. Dots in (C, D, E, F, G and H) represent data from time-lapse imaging experiments illustrated in Figure 3. Pearson’s correlation coefficient was determined for the fitted line in each plot. A single data point in (E) and (G) was determined to be an outlier (value exceeded 1.5xInterquartile Range) and was removed from correlation analysis.

References

    1. Vivier E, Raulet DH, Moretta A, Caligiuri MA, Zitvogel L, Lanier LL, Yokoyama WM, Ugolini S. Innate or Adaptive Immunity? The Example of Natural Killer Cells. Science (80-) 2011;331:44–49. - PMC - PubMed
    1. Lam VC, Lanier LL. NK cells in host responses to viral infections. Curr Opin Immunol. 2017;44:43–51. - PMC - PubMed
    1. Guillerey C, Huntington ND, Smyth MJ. Targeting natural killer cells in cancer immunotherapy. Nat Immunol. 2016;17:1025–1036. - PubMed
    1. Krzewski K, Coligan JE. Human NK cell lytic granules and regulation of their exocytosis. Front Immunol. 2012;3:335. - PMC - PubMed
    1. Orange JS. Formation and function of the lytic NK-cell immunological synapse. Nat Rev Immunol. 2008;8:713–725. - PMC - PubMed

Publication types