. 2018 May 29;92(12):e02034-17.
doi: 10.1128/JVI.02034-17. Print 2018 Jun 15.

Degradation of a Novel DNA Damage Response Protein, Tankyrase 1 Binding Protein 1, following Adenovirus Infection

Affiliations

Degradation of a Novel DNA Damage Response Protein, Tankyrase 1 Binding Protein 1, following Adenovirus Infection

Nafiseh Chalabi Hagkarim et al. J Virol. .

Abstract

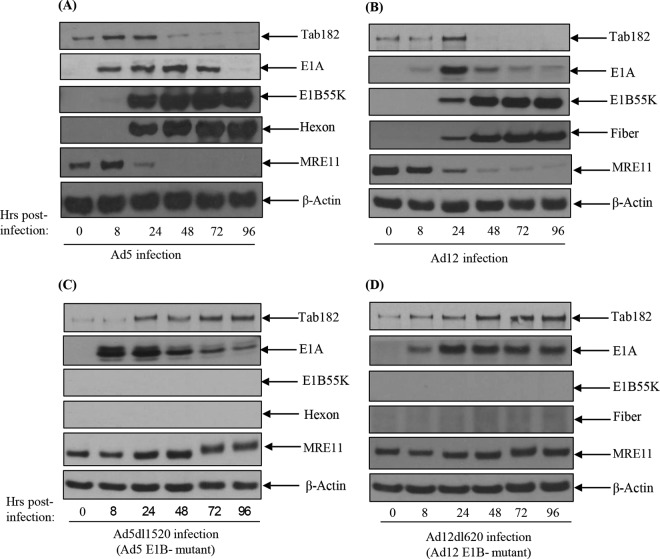
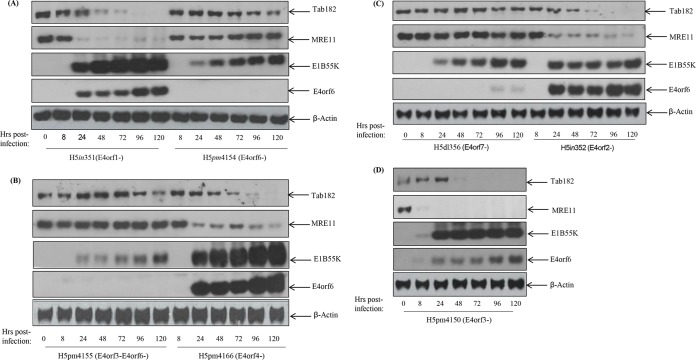
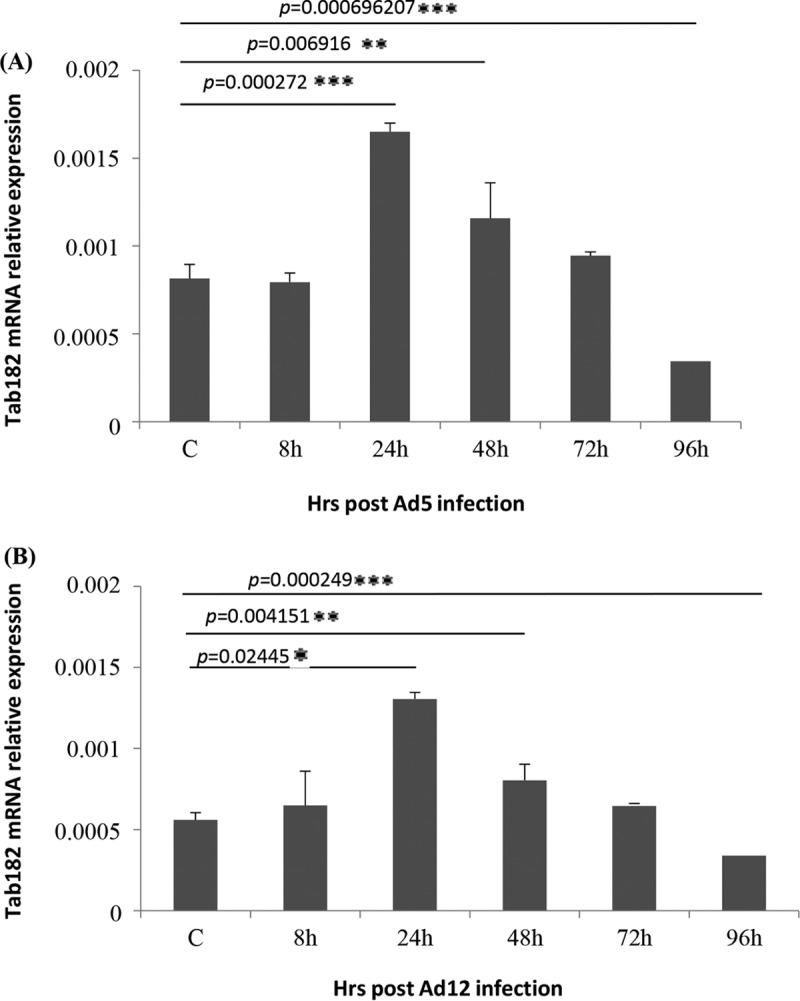
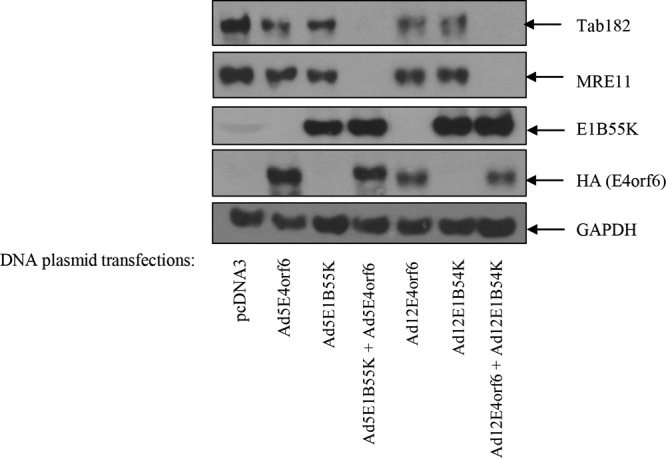
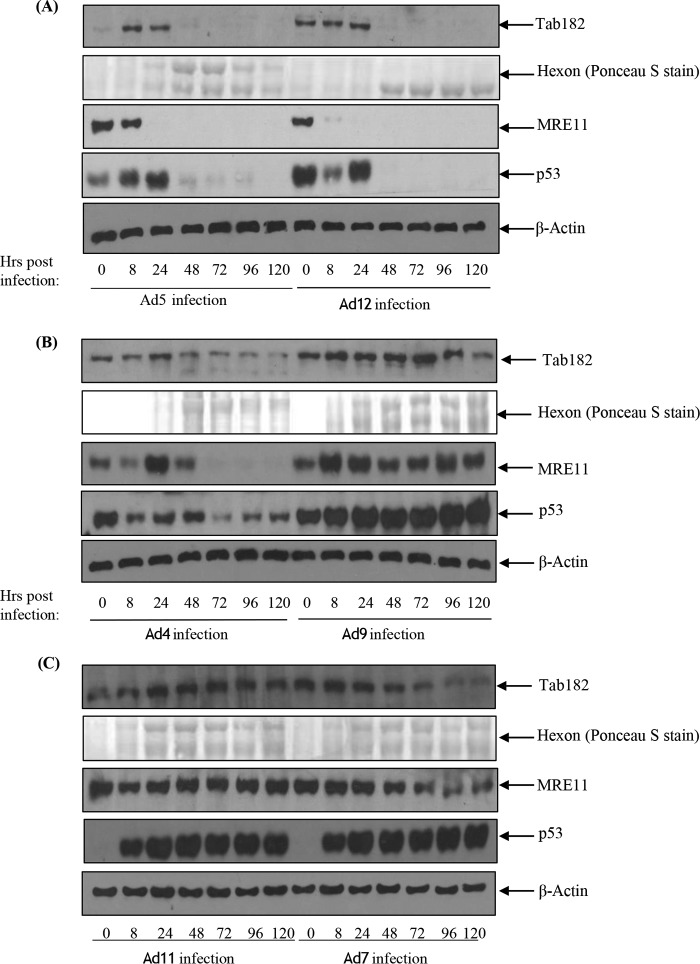
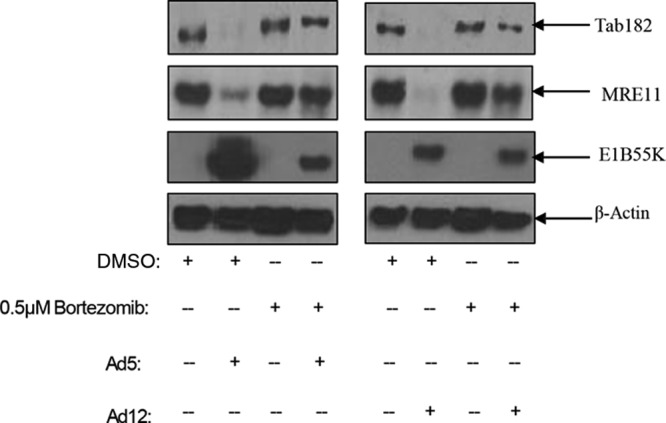
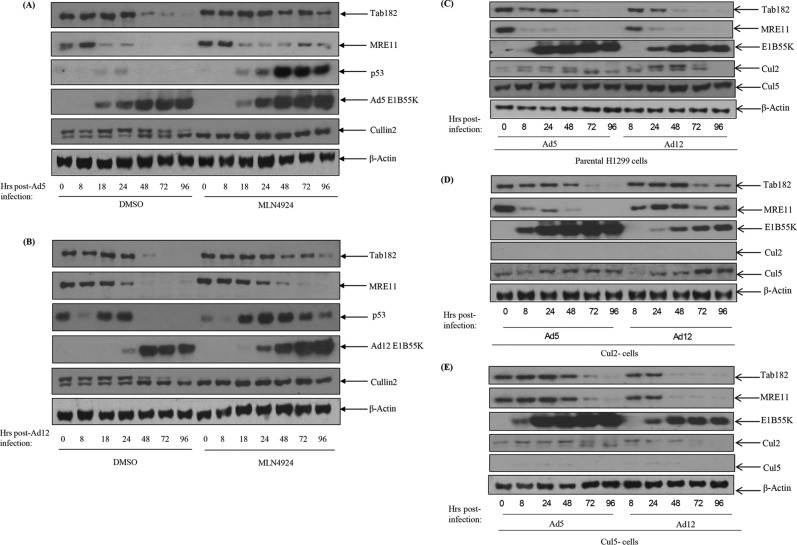
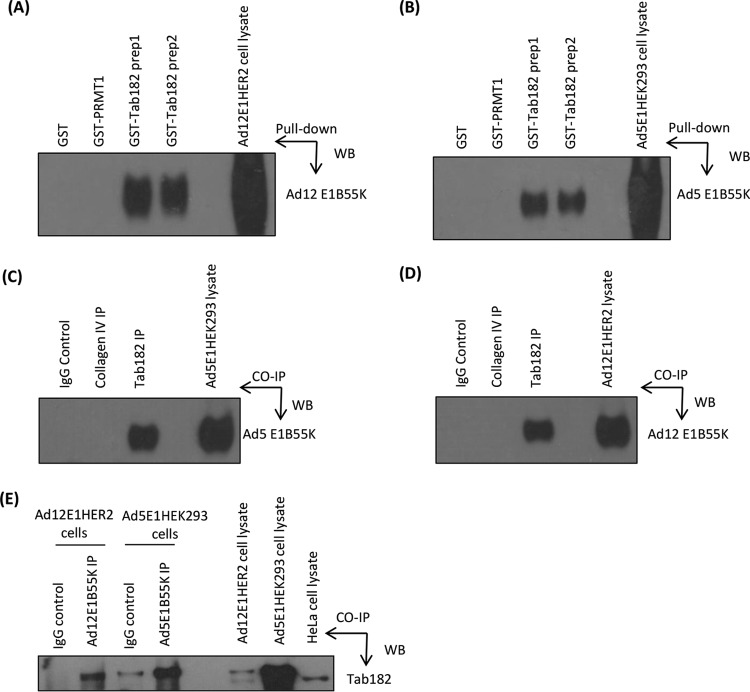
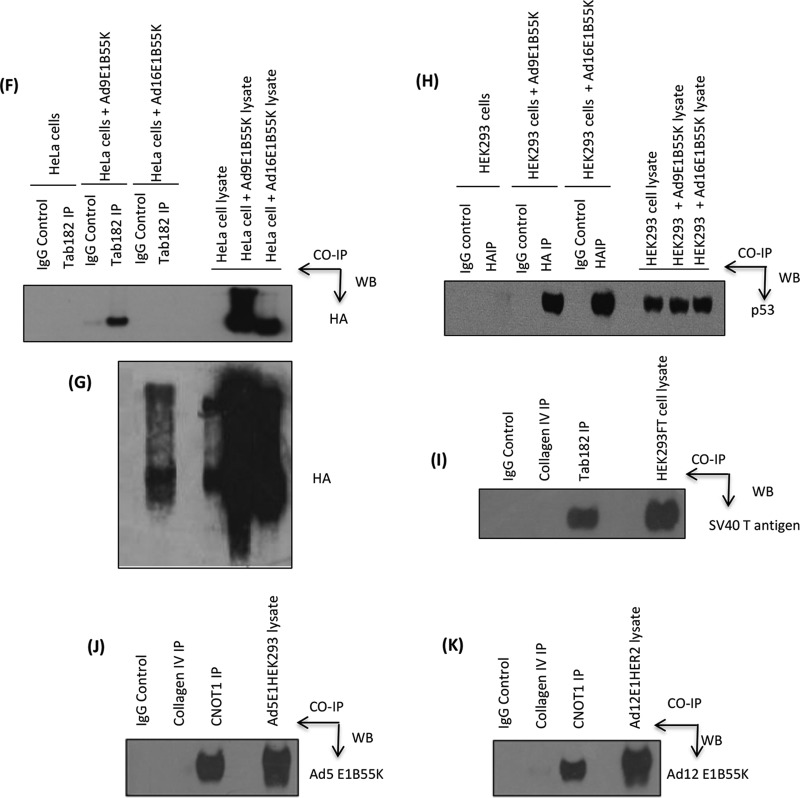
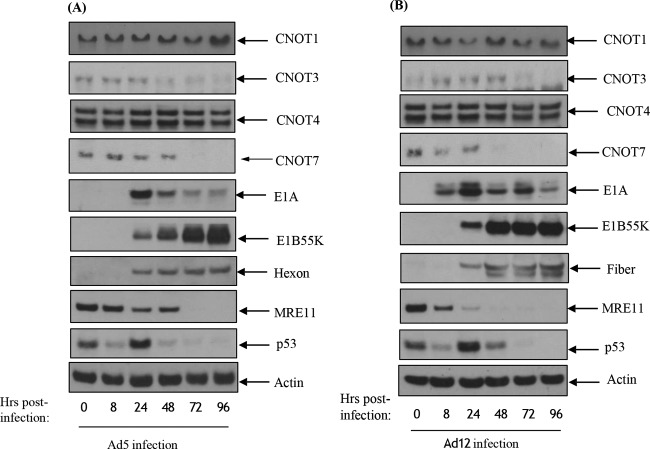
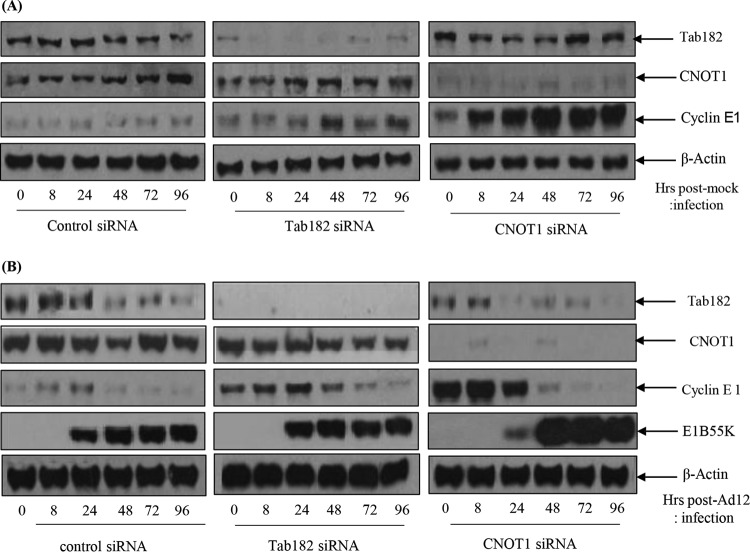
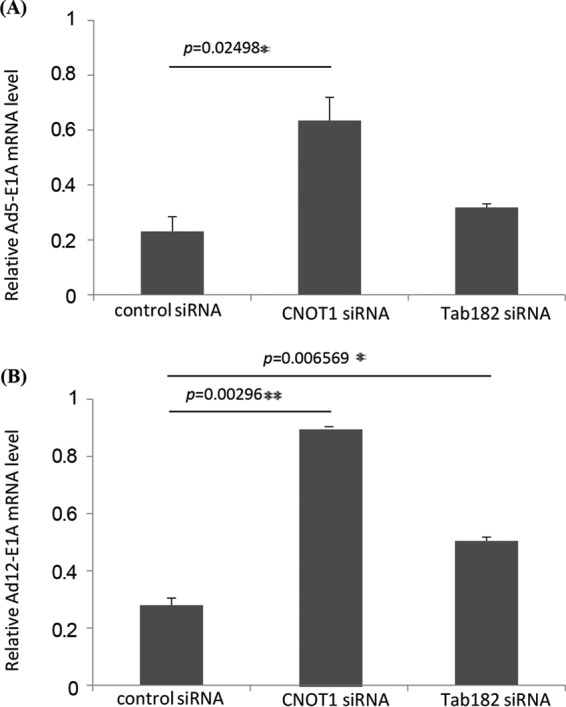
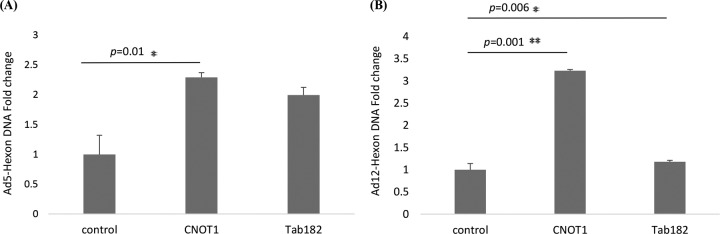
Infection by most DNA viruses activates a cellular DNA damage response (DDR), which may be to the detriment or advantage of the virus. In the case of adenoviruses, they neutralize antiviral effects of DDR activation by targeting a number of proteins for rapid proteasome-mediated degradation. We have now identified a novel DDR protein, tankyrase 1 binding protein 1 (TNKS1BP1) (also known as Tab182), which is degraded during infection by adenovirus serotype 5 and adenovirus serotype 12. In both cases, degradation requires the action of the early region 1B55K (E1B55K) and early region 4 open reading frame 6 (E4orf6) viral proteins and is mediated through the proteasome by the action of cullin-based cellular E3 ligases. The degradation of Tab182 appears to be serotype specific, as the protein remains relatively stable following infection with adenovirus serotypes 4, 7, 9, and 11. We have gone on to confirm that Tab182 is an integral component of the CNOT complex, which has transcriptional regulatory, deadenylation, and E3 ligase activities. The levels of at least 2 other members of the complex (CNOT3 and CNOT7) are also reduced during adenovirus infection, whereas the levels of CNOT4 and CNOT1 remain stable. The depletion of Tab182 with small interfering RNA (siRNA) enhances the expression of early region 1A proteins (E1As) to a limited extent during adenovirus infection, but the depletion of CNOT1 is particularly advantageous to the virus and results in a marked increase in the expression of adenovirus early proteins. In addition, the depletion of Tab182 and CNOT1 results in a limited increase in the viral DNA level during infection. We conclude that the cellular CNOT complex is a previously unidentified major target for adenoviruses during infection.IMPORTANCE Adenoviruses target a number of cellular proteins involved in the DNA damage response for rapid degradation. We have now shown that Tab182, which we have confirmed to be an integral component of the mammalian CNOT complex, is degraded following infection by adenovirus serotypes 5 and 12. This requires the viral E1B55K and E4orf6 proteins and is mediated by cullin-based E3 ligases and the proteasome. In addition to Tab182, the levels of other CNOT proteins are also reduced during adenovirus infection. Thus, CNOT3 and CNOT7, for example, are degraded, whereas CNOT4 and CNOT1 are not. The siRNA-mediated depletion of components of the complex enhances the expression of adenovirus early proteins and increases the concentration of viral DNA produced during infection. This study highlights a novel protein complex, CNOT, which is targeted for adenovirus-mediated protein degradation. To our knowledge, this is the first time that the CNOT complex has been identified as an adenoviral target.

Keywords: AdE1B55K; CNOT complex; CNOT1; TNKS1BP1; Tab182; adenovirus E1B55K; adenoviruses.


Figures

FIG 1
FIG 1
Degradation of Tab182 following infection with adenovirus serotype 5 or adenovirus serotype 12 is dependent on the adenovirus E1B55K protein. (A and B) HeLa cells were infected with adenovirus serotype 5 (A) or serotype 12 (B) at 5 PFU/cell. (C and D) HeLa cells were also infected with the adenovirus serotype 5 E1B55K-negative virus Ad5dl1520 (C) and the adenovirus serotype 12 E1B55K-negative virus Ad12dl620 (D) at 10 PFU/cell. Cells were then harvested at various time points (0, 8, 24, 48, 72, and 96 h) postinfection. Cell lysates were subjected to SDS-PAGE and Western blotting using the indicated antibodies.
FIG 2
FIG 2
Degradation of Tab182 following infection with adenovirus serotype 5 is dependent on the adenovirus E4orf6 protein. HeLa cells were infected with the Ad5 E4 mutants H5in351 (E4orf1) (A), H5pm4154 (E4orf6) (A), H5pm4155 (E4orf3 E4orf6) (B), H5pm4166 (E4orf4) (B), H5dl356 (E4orf6 E4orf7) (C), H5in352 (E4orf2) (C), and H5pm4150 (E4orf3) (D) at 10 PFU/cell. Cells were then harvested at various time points (0, 8, 24, 48, 72, and 96 h) postinfection. Cell lysates were subjected to SDS-PAGE and Western blotting using the indicated antibodies.
FIG 3
FIG 3
Tab182 gene expression is enhanced in adenovirus-infected cells. HeLa cells were infected with Ad5 or Ad12 at 5 PFU/cell. Cells were harvested at various time points (0, 8, 24, 48, 72, and 96 h) postinfection. Cellular RNA was extracted from Ad5 (A)- and Ad12 (B)-infected cells, and first-strand cDNA synthesis was carried out. RT-PCRs were performed by using Tab182-specific primers and real-time PowerUp SYBR green master mix. To determine the relative Tab182 gene expression level, calculated Tab182 CT values were normalized to CT values of GAPDH amplified from the same sample [ΔCT = CT (Tab182) − CT (GAPDH)], and the 2−ΔΔCT method was used to calculate relative expression levels. Each experiment was performed in triplicate. Western blots of Ad5- and Ad12-infected HeLa cells were performed to confirm Tab182 degradation (data not shown).
FIG 4
FIG 4
Degradation of Tab182 during adenovirus serotype 5 and 12 infection is dependent on the adenovirus E1B55K and E4orf6 proteins. Two micrograms of plasmid DNA, as shown, was transfected into HeLa cells, and 48 h later, cells were harvested and subjected to SDS-PAGE and Western blotting using the indicated antibodies. The Ad5E4orf6 and Ad12E4orf6 proteins were detected with an antibody that recognized the HA tag. GAPDH is included as a loading control.
FIG 5
FIG 5
Tab182 levels following infection by group B, D, and E adenoviruses. HeLa cells were infected with Ad5 (group C) and Ad12 (group A) (A), Ad4 (group E) and Ad9 (group D) (B), and Ad11 (group B2) and Ad7 (group B1) (C) at 5 PFU/cell. Cells were harvested at 8, 24, 48, 72, 96, and 120 h postinfection. Cell lysates were subjected to SDS-PAGE and Western blotting using antibodies against Tab182, MRE11, p53, and β-actin. Hexon expression was confirmed, as a marker of viral infection, by Ponceau S staining of Western blots for total protein.
FIG 6
FIG 6
Downregulation of Tab182 protein levels during Ad5 and Ad12 infection can be rescued by the proteasomal inhibitor bortezomib. HeLa cells were infected with Ad5 or Ad12 at 5 PFU/cell. Cells were treated with 0.5 μM bortezomib or the DMSO control and harvested after 48 h. Cell lysates were subjected to SDS-PAGE and Western blotting using the indicated antibodies.
FIG 7
FIG 7
Degradation of Tab182 during Ad5 and Ad12 infection is dependent on cullin function. HeLa cells were infected with Ad5 and Ad12 at 5 PFU/cell. Cells were treated with the Nedd8 inhibitor MLN4924 (4 μM) 1 h before infection and retreated immediately postinfection. Cells were harvested at various time points (0, 8, 24, 48, 72, and 96 h) postinfection. (A and B) Cell lysates were subjected to SDS-PAGE and Western blotting using the indicated antibodies. (C to E) H1299 cells (C) or H1299 cells with an ablation of Cul2 (D) or Cul5 (E) expression were infected with either Ad5 or Ad12 and harvested at 0, 8, 24, 48, 72, and 96 h postinfection. Cell lysates were subjected to SDS-PAGE and Western blotting with the antibodies shown.
FIG 8
FIG 8
Tab182 does not localize to viral replication centers during adenovirus infection. GFP-Tab182 was transfected into HeLa cells, and 24 h later, cells were infected with Ad5 or Ad12. (A) Thirty hours later, cells were fixed, extracted, and probed with the appropriate antibodies. (B) Thirty hours after infection, cells were preextracted as described in Materials and Methods before fixing and then staining with antibodies. In both panels A and B, Ad5-infected cells were probed with DBP antibody, while Ad12-infected cells were probed with RPA32 antibody. Nuclear DNA is stained with DAPI.
FIG 9
FIG 9
Adenovirus early region E1B55K interacts with Tab182 in vitro and in vivo. (A and B) Ad12E1HER2 (A) and Ad5E1HEK293 (B) cell lysates containing 500 μg total protein were incubated with 5 μg either GST-Tab182 or GST-PRMT1 or with GST alone. Protein complexes were captured by glutathione-agarose beads and subjected to SDS-PAGE and Western blotting (WB) with the antibodies indicated. (C and D) Ad5E1HEK293 (C) and Ad12E1HER2 (D) cell lysates (500 μg total protein) were incubated with antibodies against Tab182 and collagen IV together with IgG (nonspecific binding controls). Immunocomplexes were isolated by using protein G-agarose beads and subsequently resolved by SDS-PAGE and Western blotting using antibodies against Ad5E1B55K/Ad12E1B55K proteins. IP, immunoprecipitation. (E) GFP-Tab182 was transfected into Ad5E1HEK293 and Ad12E1HER2 cell lines, which were harvested after 48 h. Cell lysates (500 μg total protein) were incubated with Ad5E1B55K and Ad12E1B55K antibodies together with IgG. Western blotting was performed with an antibody against Tab182. (F) HeLa cells were transfected with pcDNA3 or pcDNA3 constructs expressing HA-tagged Ad9E1B55K or Ad16E1B55K. After 48 h, lysates (500 μg total protein) were immunoprecipitated with an antibody against Tab182 or rabbit IgG. Western blotting was performed with an antibody against HA. (G) Overexposed version of a portion of the Western blot shown in panel F. (H) Ad5E1HEK293 cells were transfected with pcDNA3 or pcDNA3 constructs expressing HA-tagged Ad9E1B55K or Ad16E1B55K. After 48 h, lysates (500 μg total protein) were immunoprecipitated with an antibody against HA or mouse IgG. Western blotting was performed with an antibody against p53. (I) HEK293FT cell lysates (500 μg protein) were incubated with antibodies against Tab182, collagen IV, or the IgG control. Western blotting was performed with an antibody against SV40T antigen. (J and K) Ad5E1HEK293 (J) and Ad12E1HER2 (K) cell lysates (500 μg total protein) were incubated with antibodies against CNOT1 and collagen IV together with IgG. Western blotting was performed with antibodies against Ad5E1B55K and Ad12E1B55K proteins. In all cases, the whole-cell lysates contained 15 μg of protein. Although only limited areas of the Western blots are shown, no additional bands were seen in the original autoradiographs.
FIG 9
FIG 9
Adenovirus early region E1B55K interacts with Tab182 in vitro and in vivo. (A and B) Ad12E1HER2 (A) and Ad5E1HEK293 (B) cell lysates containing 500 μg total protein were incubated with 5 μg either GST-Tab182 or GST-PRMT1 or with GST alone. Protein complexes were captured by glutathione-agarose beads and subjected to SDS-PAGE and Western blotting (WB) with the antibodies indicated. (C and D) Ad5E1HEK293 (C) and Ad12E1HER2 (D) cell lysates (500 μg total protein) were incubated with antibodies against Tab182 and collagen IV together with IgG (nonspecific binding controls). Immunocomplexes were isolated by using protein G-agarose beads and subsequently resolved by SDS-PAGE and Western blotting using antibodies against Ad5E1B55K/Ad12E1B55K proteins. IP, immunoprecipitation. (E) GFP-Tab182 was transfected into Ad5E1HEK293 and Ad12E1HER2 cell lines, which were harvested after 48 h. Cell lysates (500 μg total protein) were incubated with Ad5E1B55K and Ad12E1B55K antibodies together with IgG. Western blotting was performed with an antibody against Tab182. (F) HeLa cells were transfected with pcDNA3 or pcDNA3 constructs expressing HA-tagged Ad9E1B55K or Ad16E1B55K. After 48 h, lysates (500 μg total protein) were immunoprecipitated with an antibody against Tab182 or rabbit IgG. Western blotting was performed with an antibody against HA. (G) Overexposed version of a portion of the Western blot shown in panel F. (H) Ad5E1HEK293 cells were transfected with pcDNA3 or pcDNA3 constructs expressing HA-tagged Ad9E1B55K or Ad16E1B55K. After 48 h, lysates (500 μg total protein) were immunoprecipitated with an antibody against HA or mouse IgG. Western blotting was performed with an antibody against p53. (I) HEK293FT cell lysates (500 μg protein) were incubated with antibodies against Tab182, collagen IV, or the IgG control. Western blotting was performed with an antibody against SV40T antigen. (J and K) Ad5E1HEK293 (J) and Ad12E1HER2 (K) cell lysates (500 μg total protein) were incubated with antibodies against CNOT1 and collagen IV together with IgG. Western blotting was performed with antibodies against Ad5E1B55K and Ad12E1B55K proteins. In all cases, the whole-cell lysates contained 15 μg of protein. Although only limited areas of the Western blots are shown, no additional bands were seen in the original autoradiographs.
FIG 10
FIG 10
Adenovirus serotypes 5 and 12 degrade components of the CNOT complex. HeLa cells were infected with adenovirus serotype 5 (A) or serotype 12 (B) at 5 PFU/cell. Cells were harvested at 0, 8, 24, 48, 72, and 96 h postinfection and subjected to SDS-PAGE and Western blotting using the indicated antibodies.
FIG 11
FIG 11
AdE1A protein expression is enhanced in adenovirus-infected, Tab182- or CNOT1-depleted cells. HeLa cells were transfected with control, Tab182, or CNOT1 siRNAs. Forty-eight hours later, control, Tab182, and CNOT1 siRNA-treated cells were infected with adenovirus serotype 5 (A) or serotype 12 (B) at 5 PFU/cell. Cells were then harvested at various time points (0, 8, 24, 48, 72, and 96 h) postinfection. Cell lysates were subjected to SDS-PAGE and Western blotting using the indicated antibodies.
FIG 12
FIG 12
Expression of cyclin E and is enhanced in Tab182- and CNOT1-depleted cells. HeLa cells were transfected with control, Tab182, or CNOT1 siRNAs. Forty-eight hours later, control, Tab182, and CNOT1 siRNA-treated cells were mock infected (A) or infected with adenovirus serotype 12 (B) at 5 PFU/cell. Cells were then harvested at various time points (0, 8, 24, 48, 72, and 96 h) postinfection. Cell lysates were subjected to SDS-PAGE and Western blotting using the indicated antibodies.
FIG 13
FIG 13
The relative expression level of Ad13S E1A mRNA is increased in infected cells in the absence of CNOT1 or Tab182. HeLa cells were transfected with control, Tab182, or CNOT1 siRNAs, and 48 h later, they were infected with Ad5 (A) or Ad12 (B) at 5 PFU/cell. Cellular RNA was extracted from infected cells, and first-strand cDNA synthesis was carried out. RT-PCRs were performed by using Ad13SE1A CR3 region-specific primers and real-time PowerUp SYBR green master mix. To check E1A relative gene expression levels, calculated E1A CT values were normalized to CT values of GAPDH amplified from the same sample [ΔCT = CT (E1A) − CT (GAPDH)], and the 2−ΔΔCTmethod was used to calculate relative gene expression levels. Data are the means of results of 3 repeats. Statistical significance was determined by using Student's t test, and P values of less than 0.05 (*) or 0.01 (**) were considered significant. Error bars represent standard errors of the means.
FIG 14
FIG 14
Viral DNA synthesis is increased in Tab182- and CNOT1-depleted cells after adenovirus infection. HeLa cells were treated with control, Tab182, and CNOT1 siRNAs for 48 h and then infected with Ad5 (A) or Ad12 (B) at 5 PFU/cell. After 24 h, cells were harvested, and the total DNA was isolated. Quantitative PCR was performed to determine the relative concentration of viral DNA. Hexon CT values were normalized to CT values for GAPDH DNA amplified from the same sample. Data are the means of results from 3 repeats. Statistical significance was determined by using Student's t test, and P values of less than 0.05 (*) or 0.01 (**) were considered significant. Error bars represent standard errors of the means.

References

    1. Berk AJ. 2007. Adenoviridae: the viruses and their replication, p 2355–2394. In Knipe DM, Howley PM, Griffin DE, Lamb RA, Martin MA, Roizman B, Straus SE (ed), Fields virology, 5th ed Lippincott Williams & Wilkins, Philadelphia, PA.
    1. Berk AJ. 2005. Recent lessons in gene expression, cell cycle control, and cell biology from adenovirus. Oncogene 24:7673–7685. doi: 10.1038/sj.onc.1209040. - DOI - PubMed
    1. Gallimore PH, Turnell AS. 2001. Adenovirus E1A: remodelling the host cell, a life or death experience. Oncogene 20:7824–7835. doi: 10.1038/sj.onc.1204913. - DOI - PubMed
    1. Pelka P, Ablack JN, Fonseca GJ, Yousef AF, Mymryk JS. 2008. Intrinsic structural disorder in adenovirus E1A: a viral molecular hub linking multiple diverse processes. J Virol 82:7252–7263. doi: 10.1128/JVI.00104-08. - DOI - PMC - PubMed
    1. Endter C, Dobner T. 2004. Cell transformation by human adenoviruses. Curr Top Microbiol Immunol 273:163–214. - PubMed

Publication types