. 2018 Mar 28;10(434):eaaq1016.
doi: 10.1126/scitranslmed.aaq1016.

A conserved transcriptional response to intranasal Ebola virus exposure in nonhuman primates prior to onset of fever

Affiliations

A conserved transcriptional response to intranasal Ebola virus exposure in nonhuman primates prior to onset of fever

Emily Speranza et al. Sci Transl Med. .

Abstract

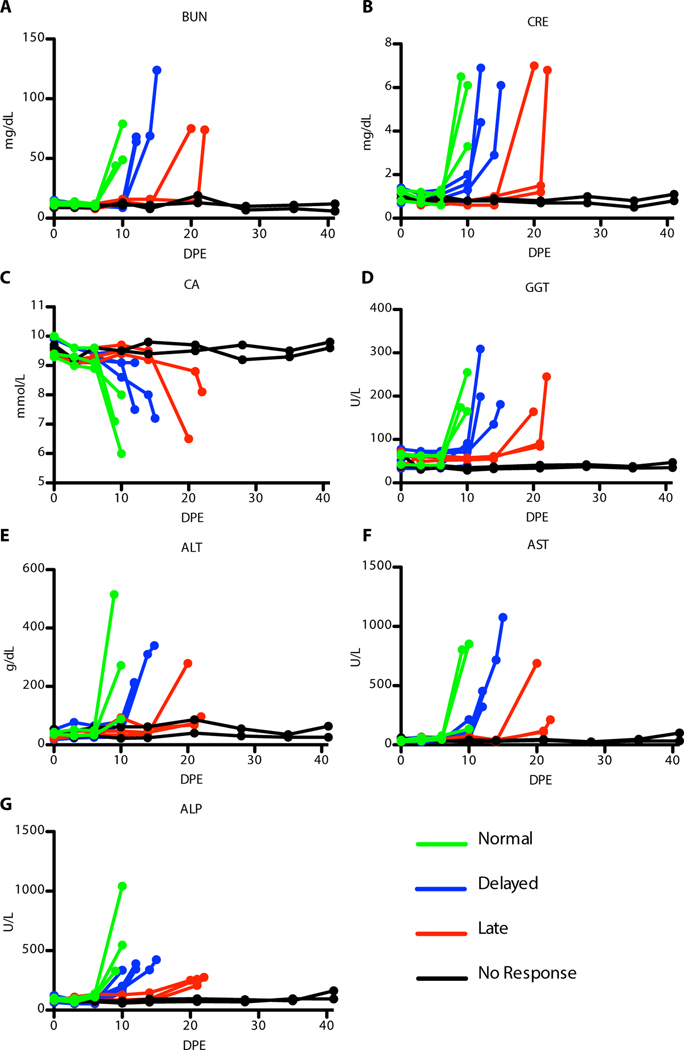
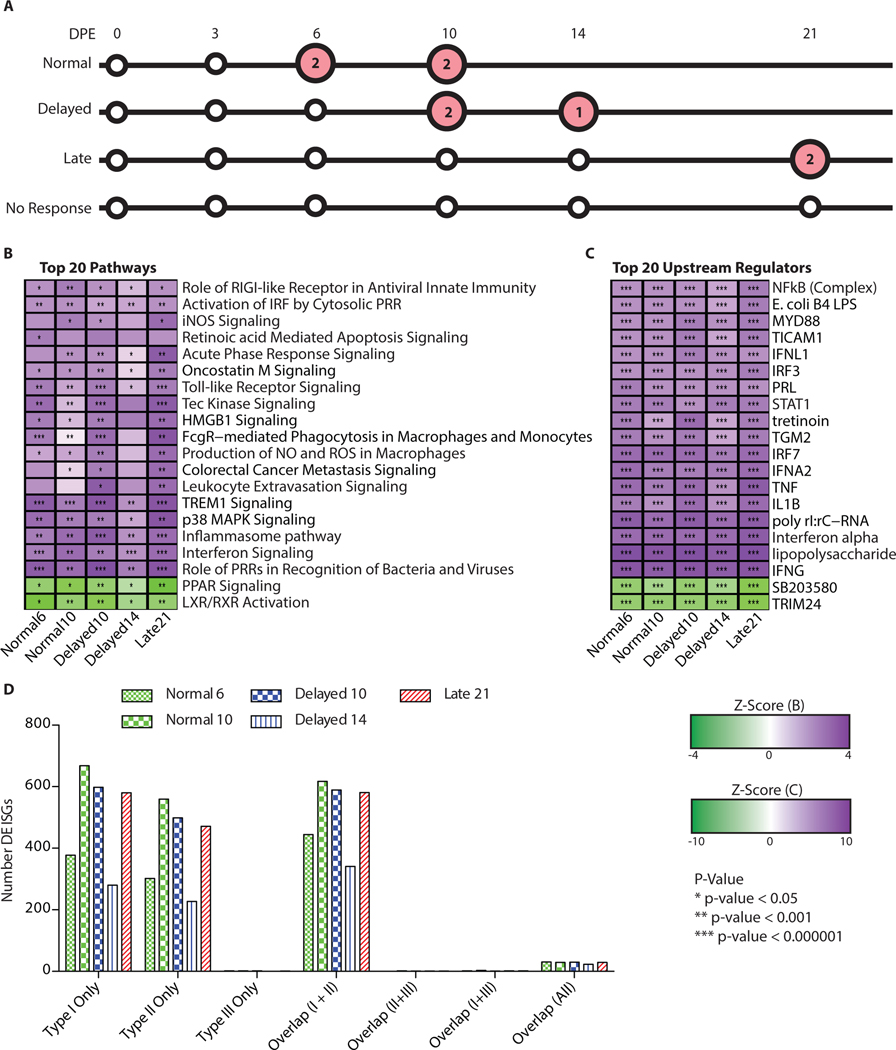
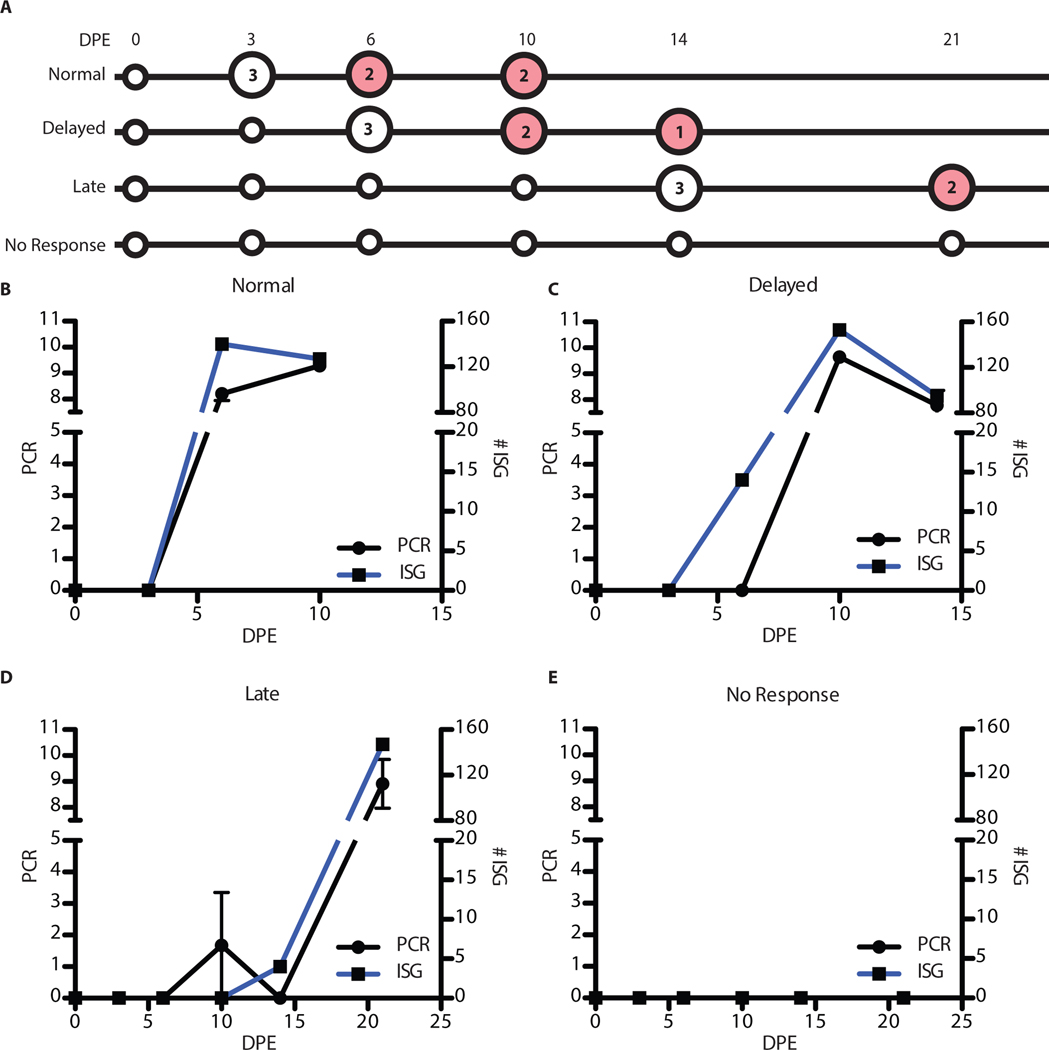
Ebola virus disease (EVD), caused by Ebola virus (EBOV), is a severe illness characterized by case fatality rates of up to 90%. The sporadic nature of outbreaks in resource-limited areas has hindered the ability to characterize the pathogenesis of EVD at all stages of infection but particularly early host responses. Pathogenesis is often studied in nonhuman primate (NHP) models of disease that replicate major aspects of human EVD. Typically, NHP models use a large infectious dose, are carried out through intramuscular or aerosol exposure, and have a fairly uniform disease course. By contrast, we report our analysis of the host response to EBOV after intranasal exposure. Twelve cynomolgus macaques were infected with 100 plaque-forming units of EBOV/Makona through intranasal exposure and presented with varying times to onset of EVD. We used RNA sequencing and a newly developed NanoString CodeSet to monitor the host response via changes in RNA transcripts over time. When individual animal gene expression data were phased based on the onset of sustained fever, the first clinical sign of severe disease, mathematical models indicated that interferon-stimulated genes appeared as early as 4 days before fever onset. This demonstrates that lethal EVD has a uniform and predictable response to infection regardless of time to onset. Furthermore, expression of a subset of genes could predict disease development before other host-based indications of infection such as fever.


Conflict of interest statement

Competing interests: The authors declare no competing interest. Opinions, interpretations, conclusions, and recommendations are those of the authors and are not necessarily endorsed by the U.S. Army.

Figures

Figure 1:
Figure 1:. Overview of the separation of animals and analysis performed.
(A) Table showing the different animals (rows) and the different days post-exposure(columns). White square signifies the animal was not PCR-positive at that time point, blue indicates they were PCR positive, and greys means that the PCR results were below the limit of quantification. The number of plus signs in the grey boxes represents the number of PCR replicates that were positive. (B) Comparison of the 4 groups and their survival curves. The x-axis is the days post-exposure and the y-axis is the percent survival. The green line is the Normal group (NHP 1,2,12), blue is the Delayed group (NHP 3,5,8,10), red is the Late group (NHP 4,6,9) and black is the No Response (NHP 7,11). (C) Overview of the RNA quantification analysis performed on the animals. The x-axis is the days post-exposure and the y-axis is the different animals organized by outcome groups (Group 1: green, Group 2: blue, Group 3: red)
Figure 2:
Figure 2:. Blood chemistry data for animals over time.
(A) Blood urea nitrogen (BUN) (B) creatinine (CRE) (C) calcium (CA) (D) gamma-glutamyl transferase (GGT) (E) alanine aminotransferase (ALT) (F) aspartate aminotransferase (AST) (G) alkaline phosphatase (ALP). Group 1 (green), Group 2 (blue), Group 3 (red), and Group 4 (black)
Figure 3:
Figure 3:. Comparison of leading pathways and upstream regulators.
Overview of the most strongly differentially regulated pathways in the viremic animals. (A) Overview of the samples analyzed (large circles) which were symptomatic (red circles) with the number of biological replicates denoted in the circles. (B) Significantly differentially regulated pathways. Heatmap is clustered on pathways (rows) (dendogram of clustering no shown). The darker purple indicates a strong up-regulation of the pathways (positive z-score) and the green means down-regulation of the pathways (negative z-score). The p-values represent if there is a significant number of genes in the pathway that are differentially expressed as determined by IPA though a Fischer’s Exact test. * < 0.05, ** < 10−3, and *** < 10−6. (C) Up-stream regulators from IPA. Purple denotes up-regulation and green denotes down-regulation (log fold change). (D) Breakdown of the interferon response to the type of interferon responsive genes. The x-axis is the specific types (Uniquely Type I, II, III) and overlap between the different responses. The red bars are samples from the Normal group, green are from Delayed, and blue is from Late. The different patterns correspond to different days post-exposure.
Figure 4:
Figure 4:. Late state cytokine response conservation.
Analysis of the conservation of the cytokine response. A) Correlation plot using only the cytokine genes. The rows and columns are the same and represent a single group at a single time point. The dendogram is colored based on a k-means clustering with 2 centers. The first color bar at the top shows the groups (green = Normal, blue = Delayed, red = Late). The second color bar indicates when the groups become symptomatic with orange for symptomatic and purple for those animals still in the incubation period. (B) Venn diagram of cluster 2 samples with cytokine genes that are differentially expressed. Spots lacking a value indicate 0 genes.
Figure 5:
Figure 5:. Early and modest immune response at day 3 post-exposure in Delayed animals.
Analysis of the NanoString samples with only the genes identified as being up-regulated at an early time point (day 3 post-exposure Delayed). (A) MA plot of the 178 up-regulated genes at day 3 post-exposure in Delayed animals. Each point represents a gene. The x-axis is the log2 of the base mean counts and the y-axis is the log2 fold change relative to day 0. (B) MA plot for the same genes at day 6 post-exposure. (C) PCA of the 178 up-regulated genes across all samples. K-means clustering was performed on all principal components with k = 3 to determine the clustering. The PCA plot is showing the first two principal components. The colors represent the different clusters.
Figure 6:
Figure 6:. Analysis of the pre-viremic ISG response.
(A) Analysis of the onset of the ISG response. Large circles represent samples that were used in the analysis with red denoting symptomatic samples. The numbers indicate how many samples were used. (B) Comparison of the onset of viremia to induction of the group of ISGs. The days post-exposure are on the x-axis. The left y-axis is the PCR values (black line) and the right is the number of genes annotated as ISGs that are up-regulated (blue line). (C) Similar plot for the Delayed animals, (D) Late animals, and (E) No response animals.
Figure 7:
Figure 7:. Correlation of NHP and human ISGs.
Analysis of the fold induction correlation with regard to the ISG response in NHPs to human fatalities. (A) Correlation plot of all ISGs that are identified as being differentially regulated at any time point in the NHP dataset. The x-axis is the log2 fold change for the Normal animals at day 6 post-exposure and the y axis is the log to fold change for the Delayed animals at day 10 post-exposure (red points and line) or the Late animals at day 21 post-exposure (blue points and line). The lines are linear fits. (B) Correlation of the human fatal cases (log2 fold change compared to controls) on the x-axis and the fold change of the Late group (log2 fold change compared to controls) at day 21 post-exposure. The line represents a linear fit of the data. (C) Correlation plot similar to B but with only the early ISGs shown. D) table of the genes in C with their comparison of the log2 fold change in humans and NHPs. Reported p-values are from a correlation test.
Figure 8:
Figure 8:. Host response to infection modeled relative to fever onset.
Alignment and modeling of gene expression across the four NHP groups. (A) Example gene (ISG15) expression (log2 fold change, y-axis) in the NanoString dataset relative to day post-exposure (x-axis). (B) Expression of the same example gene (log2 fold change, y-axis) relative to the onset of a fever (0) on the y-axis. Green line is the Normal animals, blue is the Delayed animals, and red is the Late animals. (C) Logistic model fit for the expression of ISG15 relative to the onset of fever. The points are the mean log2 fold change for a group at its time relative to fever onset and the solid line is the model fit for the fold change. (D) Comparison of the early ISG expression (black lines) logistic model fit relative to the onset of fever (x-axis) to many cytokine genes (red lines). The dashed line is for a reference of when the genes expression crosses the threshold of a log2 fold change > 2.

Similar articles

Cited by

References

    1. Feldman H, Geisbert T, Ebola haemorrhagic fever., Lancet 377, 849–862 (2012). - PMC - PubMed
    1. Center for Disease Control (CDC), 2014. Ebola Outbreak in West Africa - Case Counts | Ebola Hemorrhagic Fever | CDC (available at https://www.cdc.gov/vhf/ebola/outbreaks/2014-west-africa/case-counts.html).
    1. Nakayama E, Saijo M, Animal models for Ebola and Marburg virus infectionsFront. Microbiol. 4 (2013), doi:10.3389/fmicb.2013.00267. - DOI - PMC - PubMed
    1. Bente D, Gren J, Strong JE, Feldmann H, Disease modeling for Ebola and Marburg viruses, Dis. Model. Mech 2, 12–17 (2009). - PMC - PubMed
    1. Johnson E, Jaax N, White J, Jahrling P, Lethal experimental infections of rhesus monkeys by aerosolized Ebola virus., Int. J. Exp. Pathol 76, 227–36 (1995). - PMC - PubMed

Publication types

MeSH terms