

Specific adaptation to strong competitors can offset the negative effects of population size reductions
- PMID: 29593112
- PMCID: PMC5897643
- DOI: 10.1098/rspb.2018.0007
Specific adaptation to strong competitors can offset the negative effects of population size reductions
Abstract
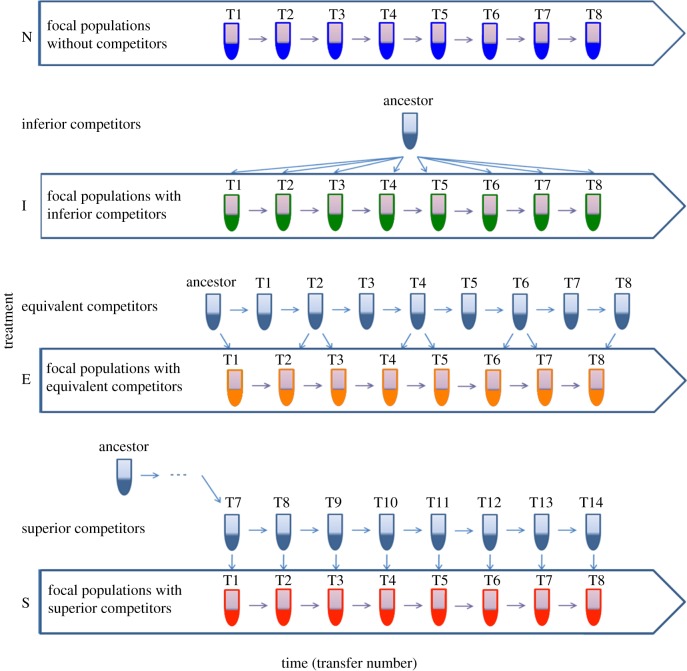
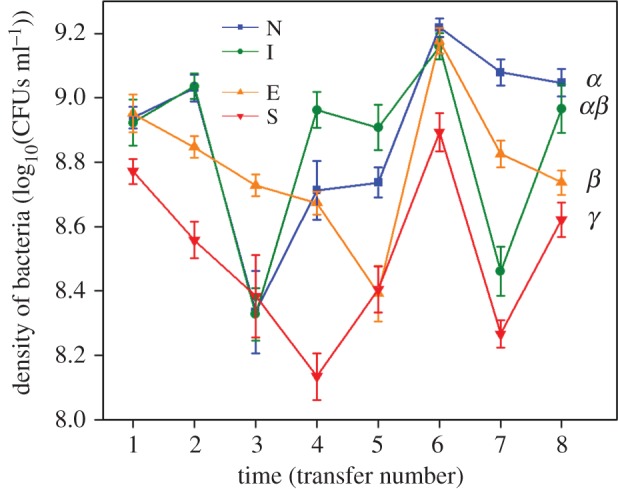
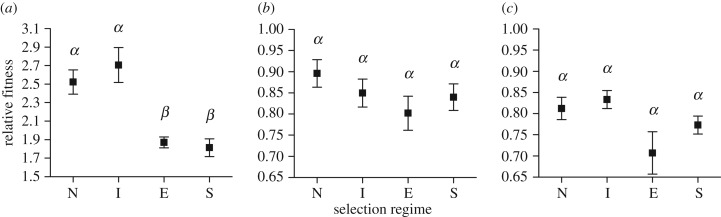
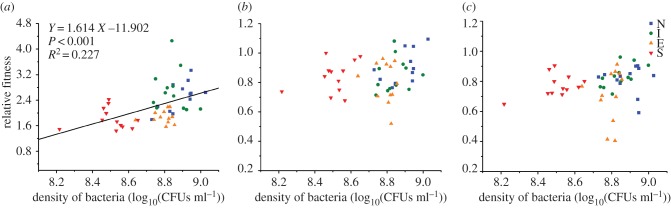
Competition plays a crucial role in determining adaptation of species, yet we know little as to how adaptation is affected by the strength of competition. On the one hand, strong competition typically results in population size reductions, which can hamper adaptation owing to a shortage of beneficial mutations; on the other hand, specificity of adaptation to competitors may offset the negative evolutionary consequences of such population size effects. Here, we investigate how competition strength affects population fitness in the bacterium Pseudomonas fluorescens Our results demonstrate that strong competition constrains adaptation of focal populations, which can be partially explained by population size reductions. However, fitness assays also reveal specific adaptation of focal populations to particular competitors varying in competitive ability. Additionally, this specific adaptation can offset the negative effects of competitor-mediated population size reductions under strong competition. Our study, therefore, highlights the importance of opposing effects of strong competition on species adaptation, which may lead to different outcomes of colonization under intense and relaxed competitive environments in the context of population dispersal.
Keywords: Pseudomonas fluorescens; adaptation; competition strength; population size reduction.
© 2018 The Author(s).
Conflict of interest statement
We declare we have no competing interests.
Figures

Similar articles
-
Competition both drives and impedes diversification in a model adaptive radiation.Proc Biol Sci. 2013 Sep 7;280(1766):20131253. doi: 10.1098/rspb.2013.1253. Print 2013 Sep 7. Proc Biol Sci. 2013. PMID: 23843392 Free PMC article.
-
Mutations of intermediate effect are responsible for adaptation in evolving Pseudomonas fluorescens populations.Biol Lett. 2006 Jun 22;2(2):236-8. doi: 10.1098/rsbl.2006.0439. Biol Lett. 2006. PMID: 17148371 Free PMC article.
-
Phylogenetic context determines the role of competition in adaptive radiation.Proc Biol Sci. 2016 Jun 29;283(1833):20160241. doi: 10.1098/rspb.2016.0241. Proc Biol Sci. 2016. PMID: 27335414 Free PMC article.
-
Adaptive radiation of Pseudomonas fluorescens SBW25 in experimental microcosms provides an understanding of the evolutionary ecology and molecular biology of A-L interface biofilm formation.FEMS Microbiol Lett. 2017 Jul 3;364(12). doi: 10.1093/femsle/fnx109. FEMS Microbiol Lett. 2017. PMID: 28535292 Review.
-
Evolution of competitive fitness in experimental populations of E. coli: what makes one genotype a better competitor than another?Antonie Van Leeuwenhoek. 1998 Jan;73(1):35-47. doi: 10.1023/a:1000675521611. Antonie Van Leeuwenhoek. 1998. PMID: 9602277 Review.
Cited by
-
Experimental Design, Population Dynamics, and Diversity in Microbial Experimental Evolution.Microbiol Mol Biol Rev. 2018 Jul 25;82(3):e00008-18. doi: 10.1128/MMBR.00008-18. Print 2018 Sep. Microbiol Mol Biol Rev. 2018. PMID: 30045954 Free PMC article. Review.
-
Performance in a novel environment subject to ghost competition.PeerJ. 2020 Apr 29;8:e8931. doi: 10.7717/peerj.8931. eCollection 2020. PeerJ. 2020. PMID: 32391198 Free PMC article.
-
Interspecific Niche Competition Increases Morphological Diversity in Multi-Species Microbial Communities.Front Microbiol. 2021 Jul 30;12:699190. doi: 10.3389/fmicb.2021.699190. eCollection 2021. Front Microbiol. 2021. PMID: 34394041 Free PMC article.
-
Is species richness mediated by functional and genetic divergence? A global analysis in birds.Funct Ecol. 2023 Jan;37(1):125-138. doi: 10.1111/1365-2435.14153. Epub 2022 Aug 9. Funct Ecol. 2023. PMID: 37064506 Free PMC article.
-
Experimental evolution for cell biology.Trends Cell Biol. 2023 Nov;33(11):903-912. doi: 10.1016/j.tcb.2023.04.006. Epub 2023 May 13. Trends Cell Biol. 2023. PMID: 37188561 Free PMC article. Review.
References
-
- Thompson JN. 2013. Relentless evolution. Chicago, IL: University Chicago Press.
Publication types
MeSH terms
Substances
Associated data
Grants and funding
LinkOut - more resources
Full Text Sources
Other Literature Sources
