. 2018 Mar 28;9(1):1242.
doi: 10.1038/s41467-018-03522-3.

Evidence for functional pre-coupled complexes of receptor heteromers and adenylyl cyclase

Affiliations

Evidence for functional pre-coupled complexes of receptor heteromers and adenylyl cyclase

Gemma Navarro et al. Nat Commun. .

Abstract

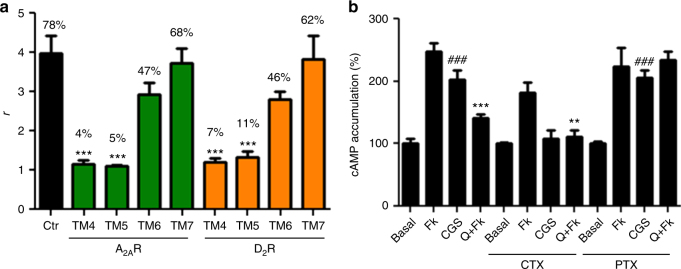
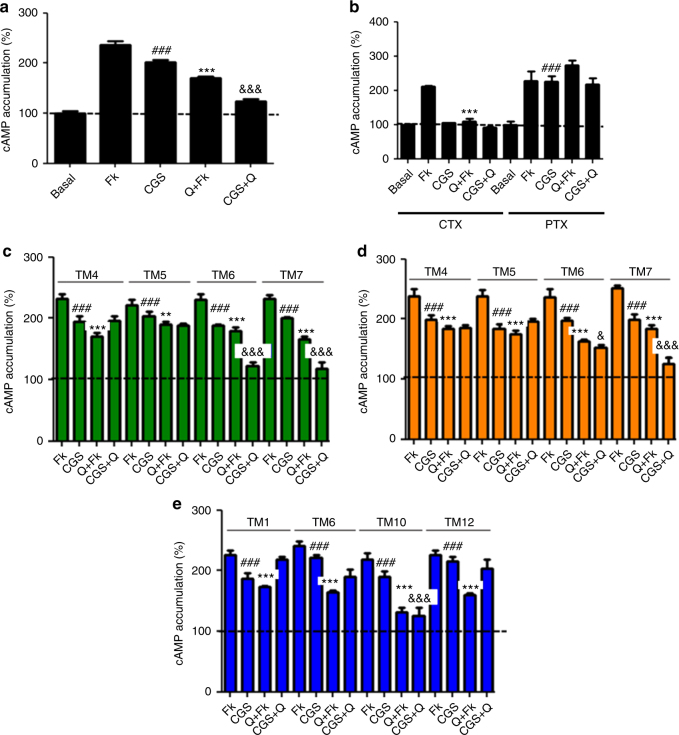
G protein-coupled receptors (GPCRs), G proteins and adenylyl cyclase (AC) comprise one of the most studied transmembrane cell signaling pathways. However, it is unknown whether the ligand-dependent interactions between these signaling molecules are based on random collisions or the rearrangement of pre-coupled elements in a macromolecular complex. Furthermore, it remains controversial whether a GPCR homodimer coupled to a single heterotrimeric G protein constitutes a common functional unit. Using a peptide-based approach, we here report evidence for the existence of functional pre-coupled complexes of heteromers of adenosine A2A receptor and dopamine D2 receptor homodimers coupled to their cognate Gs and Gi proteins and to subtype 5 AC. We also demonstrate that this macromolecular complex provides the necessary frame for the canonical Gs-Gi interactions at the AC level, sustaining the ability of a Gi-coupled GPCR to counteract AC activation mediated by a Gs-coupled GPCR.


Conflict of interest statement

The authors declare no competing interests.

Figures

Fig. 1
Fig. 1
Quaternary structure of A2AR-D2R heterotetramer coupled to Gs and Gi proteins. ac BiFC experiments in HEK-293T cells transfected with A2AR-nYFP (0.5 μg) and A2AR-cYFP (0.5 μg) cDNA in the absence or presence of D2R cDNA (0.5 μg) (a), with D2R-nYFP (0.75 μg) and D2R-cYFP (0.75 μg) cDNA in the absence or the presence of A2AR cDNA (0.4 μg) (b) or with A2AR-nYFP (0.6 μg) and D2R-cYFP (0.6 μg) cDNA (c); cells were treated for 4 h with medium (broken lines) or 4 μM of indicated TM peptides (numbered 1–7) of A2AR (green squares) or D2R (orange squares) before addition of medium, CGS21680 (CGS; 100 nM) or quinpirole (Q; 1 μM); fluorescence was detected at 530 nm and values (in means ± SEM) are expressed as fluorescence arbitrary units (n = 8, with triplicates); *, **, and *** represent significantly lower values as compared to control values (p < 0.05, p < 0.01 and p < 0.001, respectively; one-way ANOVA followed by Dunnett’s multiple comparison tests). d Computational model of the A2AR-D2R heterotetramer built using the experimental interfaces predicted in panels (ac) (TMs 4/5 for heterodimerization and TM 6 for homodimerization) with Gs and Gi binding to the external protomers; schematic slice-representation (left) and the constructed molecular model (right; with the same color code as the schematic slice-representation), viewed from the extracellular side
Fig. 2
Fig. 2
Functional A2AR–D2R heterotetramers in transfected cells. a Quantification from PLA experiments (see Supplementary Fig. 1) performed in HEK-293T cells transfected with 0.4 μg of A2AR and 0.5 μg of D2R cDNA treated for 4 h with medium (control) or 4 μM of indicated TM peptides of A2AR or D2R; values are expressed as the ratio between the number of red spots representing heteromers in confocal microscopy images and the number of cells showing spots (r) (30–50 cells from three independent preparations); % values represent the percentage of cells showing one or more red spots; ***p < 0.001, as compared to control (one-way ANOVA followed by Dunnett’s multiple comparison tests). b cAMP production in HEK-293T cells transfected as in (a); cells were incubated overnight with vehicle or pertussis toxin (PTX; 10 ng/ml), or for 2 h with cholera toxin (CTX; 100 ng/ml), and exposed to CGS21680 (CGS; 100 nM) or quinpirole (Q; 1 μM) in the absence or in the presence of forskolin (Fk; 0.5 μM), respectively; values are expressed as percentage over cAMP accumulation in non-treated cells (basal) (n = 5–7, with triplicates); ###p < 0.001, as compared to basal values; ** and ***p < 0.01 and p < 0.001 as compared to Fk, respectively; one-way ANOVA followed by Tukey’s multiple comparison tests. Results are always represented as means ± SEM
Fig. 3
Fig. 3
Involvement of receptor TMs in A2AR–D2R heterotetramer-AC5 oligomerization. ad BRET saturation experiments in HEK-293T cells transfected with 0.5 μg of A2AR-Rluc cDNA and increasing amounts of AC5-YFP cDNA (0.3–2.5 μg) not co-transfected (a) or co-transfected (c) with D2R cDNA (0.5 μg), or with 0.75 μg of D2R-Rluc cDNA and increasing amounts of AC5-YFP cDNA (0.3–2.5 μg) not co-transfected (b) or co-transfected (d) with A2AR cDNA (0.4 μg); the relative amount of BRET is given as a function of 1000× the ratio between the fluorescence of the acceptor (YFP) and the luciferase activity of the donor (Rluc) and expressed as milli BRET units (mBU) (6–8 experiments, with duplicates, grouped as a function of the amount of BRET acceptor). e, f BiFC experiments in HEK-293T cells transfected with AC5-nYFP (0.75 μg), A2AR-cYFP (0.5 μg) and D2R (0.75 μg) cDNA (e) or AC5-nYFP (0.75 μg), D2R-cYFP (0.75 μg) and A2AR (0.4 μg) cDNA (f); cells were treated for 4 h with medium (dotted lines) or 4 μM of indicated TM peptides (numbered 1–7) of A2AR (e) or D2R (f) before addition of medium, CGS21680 (CGS; 100 nM; e) or quinpirole (Q; 1 μM; f); fluorescence was detected at 530 nm and values are expressed as arbitrary fluorescent units (n = 8, with triplicates); *, ** and *** represent significantly lower values as compared to control values (p < 0.05, p < 0.01 and p < 0.001, respectively; one-way ANOVA followed by Dunnett’s multiple comparison tests). Results are always represented as means ± SEM
Fig. 4
Fig. 4
Involvement of AC5 TMs in A2AR-D2R heterotetramer-AC5 oligomerization. ad BiFC experiments in HEK-293T cells transfected with AC5-nYFP (0.75 μg), A2AR-cYFP (0.5 μg) and D2R (0.75 μg) cDNA (a, c) or AC5-nYFP (0.75 μg), D2R-cYFP (0.75 μg) and A2AR (0.4 μg) cDNA (b, d); cells were treated for 4 h with medium (dotted lines) or 4 μM of indicated TM peptides predicted from Uniprot algorithm (numbered 1–12) (a, b) or control peptides (numbered 2n−6n and 5b; see text) (c, d), before addition of medium, CGS21680 (CGS; 100 nM) or quinpirole (Q; 1 μM); fluorescence was detected at 530 nm and values (in means ± SEM) are expressed as arbitrary fluorescent units (n = 8, with triplicates); *, ** and *** represent significantly lower values as compared to control values (p < 0.05, p < 0.01, and p < 0.001, respectively; one-way ANOVA followed by Dunnett’s multiple comparison tests). eg Schematic slice-representations of A2AR–D2R heterotetramer-AC5 models: heterotetramer coupled with two AC5 molecules in the absence (e) and in the presence (f) of agonists; extension of the agonist-bound complex with a second A2AR–D2R heterotetramer, with simultaneous binding of both Gαs and Gαi to the central C1 and C2 domains of AC5 (g). Schematic slice-representation viewed from the extracellular side of the A2AR–D2R heterotetramer in complex with Gs, Gi, and AC5 in the absence and presence of agonists are shown in Supplementary Fig. 6
Fig. 5
Fig. 5
A2AR-D2R heterotetramer expression in striatal neurons in culture. Proximity ligation assay (PLA) in rat striatal primary cultures. a, c Confocal microscopy images (superimposed sections) are shown in which A2AR-D2R heteromers appear as red spots. Primary cultures were treated for 4 h with medium (a) or 4 μM of indicated TM peptides (numbered 1–7) of A2AR or D2R (c); cell nuclei were stained with DAPI (blue); scale bars: 20 μm. b Quantification from PLA experiments: values (in means ± SEM) are expressed as the ratio between the number of red spots and the number of cells showing spots (r) (20–30 neurons from three independent preparations); % values represent the percentage of cells showing one or more red spots; ***p < 0.001, as compared to control (one-way ANOVA followed by Dunnett’s multiple comparison tests)
Fig. 6
Fig. 6
Canonical Gs–Gi antagonistic interaction in striatal neurons in culture. a, b cAMP production determined in rat striatal primary cultures incubated overnight with vehicle (a) or with pertussis toxin (PTX; 10 ng/ml), or for 2 h with cholera toxin (CTX; 100 ng/ml) (b), and exposed to CGS21680 (CGS; 100 nM), quinpirole (Q; 1 μM) or both in the absence or in the presence of forskolin (Fk; 0.5 μM), respectively. ce cAMP production determined in rat striatal primary cultures incubated 4 h with 4 μM of indicated TM peptides of A2AR (c), D2R (d), or AC5 (e) and exposed to agonists as in a, b. Values (in means ± SEM) are expressed as percentage of cAMP accumulation in non-treated cells (basal) (n = 5–7, with triplicates); ###p < 0.001, as compared to basal values; ** and ***p < 0.01 and p < 0.001 as compared to Fk, respectively; &, &&&p < 0.05 and p < 0.001 as compared to CGS, respectively; one-way ANOVA followed by Tukey’s multiple comparison tests

Similar articles

Cited by

References

    1. Gilman AG. G proteins: transducers of receptor-generated signals. Annu. Rev. Biochem. 1987;56:615–649. doi: 10.1146/annurev.bi.56.070187.003151. - DOI - PubMed
    1. Ferré S. The GPCR heterotetramer: challenging classical pharmacology. Trends Pharmacol. Sci. 2015;36:145–152. doi: 10.1016/j.tips.2015.01.002. - DOI - PMC - PubMed
    1. Banères JL, Parello J. Structure-based analysis of GPCR function: evidence for a novel pentameric assembly between the dimeric leukotriene B4 receptor BLT1 and the G-protein. J. Mol. Biol. 2003;329:815–829. doi: 10.1016/S0022-2836(03)00439-X. - DOI - PubMed
    1. Han Y, Moreira IS, Urizar E, Weinstein H, Javitch JA. Allosteric communication between protomers of dopamine class A GPCR dimers modulates activation. Nat. Chem. Biol. 2009;5:688–695. doi: 10.1038/nchembio.199. - DOI - PMC - PubMed
    1. Pellissier LP, et al. G protein activation by serotonin type 4 receptor dimers: evidence that turning on two protomers is more efficient. J. Biol. Chem. 2011;286:9985–9997. doi: 10.1074/jbc.M110.201939. - DOI - PMC - PubMed

Publication types

MeSH terms