

Large-scale sequence analysis reveals novel human-adaptive markers in PB2 segment of seasonal influenza A viruses
- PMID: 29593225
- PMCID: PMC5874250
- DOI: 10.1038/s41426-018-0050-0
Large-scale sequence analysis reveals novel human-adaptive markers in PB2 segment of seasonal influenza A viruses
Abstract
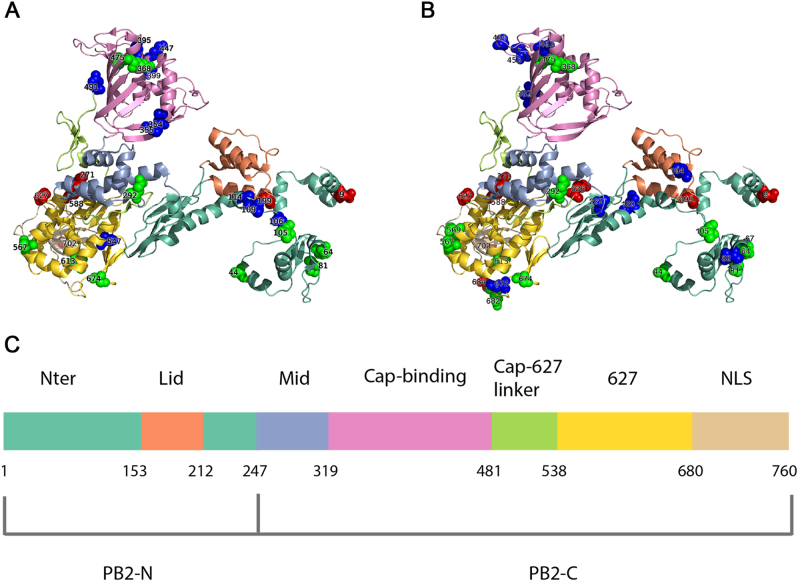
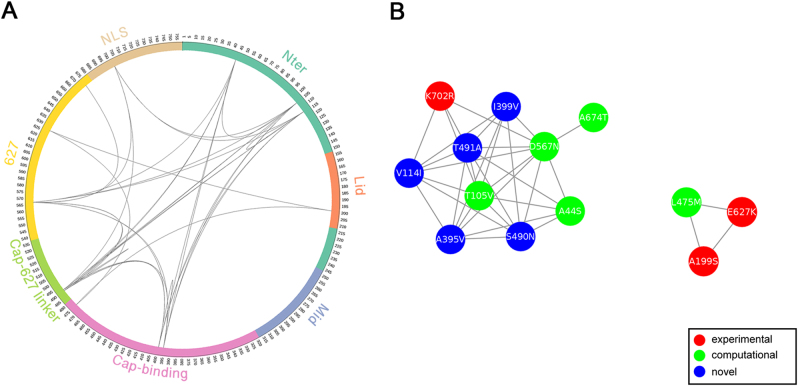
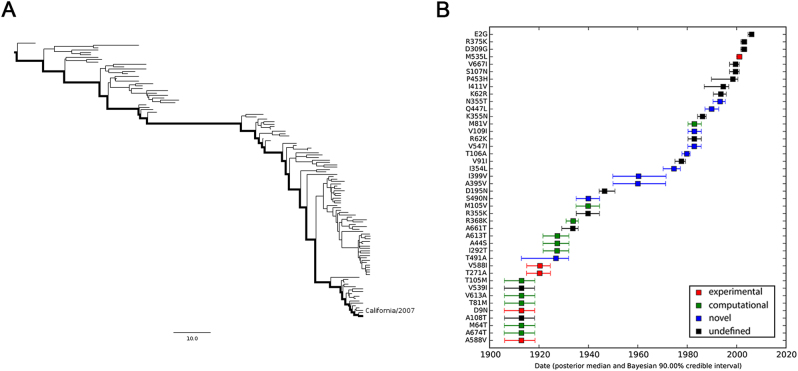
To elucidate the adaptive strategies of influenza A viruses (IAVs) to human, we proposed a computational approach to identify human-adaptive mutations in seasonal IAVs, which have not been analyzed comprehensively. We compared representative PB2 sequences of 1425 avian IAVs and 2176 human IAVs and identified a total of 42 human-adaptive markers, including 28 and 31 markers in PB2 proteins of seasonal viruses H1N1 and H3N2, respectively. Notably, this comprehensive list encompasses almost all the markers identified in prior computational studies and 21 novel markers including an experimentally verified mutation K526R, suggesting the predictive power of our method. The strength of our analysis derives from the enormous amount of recently available sequences as well as the recognition that human-adaptive mutations are not necessarily conserved across subtypes. We also utilized mutual information to profile the inter-residue coevolution in PB2 protein. A total of 35 and 46 coevolving site pairs are identified in H1N1 and H3N2, respectively. Interestingly, 13 out of the 28 (46.4%) identified markers in H1N1 and 16 out of the 31 (51.6%) in H3N2 are embraced in the coevolving pairs. Many of them are paired with well-characterized human-adaptive mutations, indicating potential epistatic effect of these coevolving residues in human adaptation. Additionally, we reconstructed the PB2 evolutionary history of seasonal IAVs and demonstrated the distinct adaptive pathway of PB2 segment after reassortment from H1 to H3 lineage. Our study may provide clues for further experimental validation of human-adaptive mutations and shed light on the human adaptation process of seasonal IAVs.
Conflict of interest statement
The authors declare that they have no conflict of interest.
Figures
Similar articles
-
Seasonal H3N2 and 2009 Pandemic H1N1 Influenza A Viruses Reassort Efficiently but Produce Attenuated Progeny.J Virol. 2017 Aug 10;91(17):e00830-17. doi: 10.1128/JVI.00830-17. Print 2017 Sep 1. J Virol. 2017. PMID: 28637755 Free PMC article.
-
Origins and Evolutionary Dynamics of H3N2 Canine Influenza Virus.J Virol. 2015 May;89(10):5406-18. doi: 10.1128/JVI.03395-14. Epub 2015 Mar 4. J Virol. 2015. PMID: 25740996 Free PMC article.
-
A point mutation in the polymerase protein PB2 allows a reassortant H9N2 influenza isolate of wild-bird origin to replicate in human cells.Infect Genet Evol. 2016 Jul;41:279-288. doi: 10.1016/j.meegid.2016.04.011. Epub 2016 Apr 14. Infect Genet Evol. 2016. PMID: 27101787 Free PMC article.
-
Implications of segment mismatch for influenza A virus evolution.J Gen Virol. 2018 Jan;99(1):3-16. doi: 10.1099/jgv.0.000989. Epub 2017 Dec 15. J Gen Virol. 2018. PMID: 29244017 Free PMC article. Review.
-
[Swine influenza virus: evolution mechanism and epidemic characterization--a review].Wei Sheng Wu Xue Bao. 2009 Sep;49(9):1138-45. Wei Sheng Wu Xue Bao. 2009. PMID: 20030049 Review. Chinese.
Cited by
-
Vaccination and Antiviral Treatment against Avian Influenza H5Nx Viruses: A Harbinger of Virus Control or Evolution.Vaccines (Basel). 2023 Oct 24;11(11):1628. doi: 10.3390/vaccines11111628. Vaccines (Basel). 2023. PMID: 38005960 Free PMC article. Review.
-
Mutual information networks reveal evolutionary relationships within the influenza A virus polymerase.bioRxiv [Preprint]. 2023 Feb 17:2023.02.16.528850. doi: 10.1101/2023.02.16.528850. bioRxiv. 2023. Update in: Virus Evol. 2023 May 27;9(1):vead037. doi: 10.1093/ve/vead037. PMID: 36824962 Free PMC article. Updated. Preprint.
-
Co-circulation of multiple influenza A reassortants in swine harboring genes from seasonal human and swine influenza viruses.Elife. 2021 Jul 27;10:e60940. doi: 10.7554/eLife.60940. Elife. 2021. PMID: 34313225 Free PMC article.
-
Mutual information networks reveal evolutionary relationships within the influenza A virus polymerase.Virus Evol. 2023 May 27;9(1):vead037. doi: 10.1093/ve/vead037. eCollection 2023. Virus Evol. 2023. PMID: 37325086 Free PMC article.
-
Novel Clade 2.3.4.4b Highly Pathogenic Avian Influenza A H5N8 and H5N5 Viruses in Denmark, 2020.Viruses. 2021 May 11;13(5):886. doi: 10.3390/v13050886. Viruses. 2021. PMID: 34065033 Free PMC article.
References
MeSH terms
Substances
LinkOut - more resources
Full Text Sources
Other Literature Sources
Medical