. 2018 Mar 29;7(1):50.
doi: 10.1038/s41426-018-0047-8.

Emerging recombinant noroviruses identified by clinical and waste water screening

Affiliations

Emerging recombinant noroviruses identified by clinical and waste water screening

Jennifer H Lun et al. Emerg Microbes Infect. .

Abstract

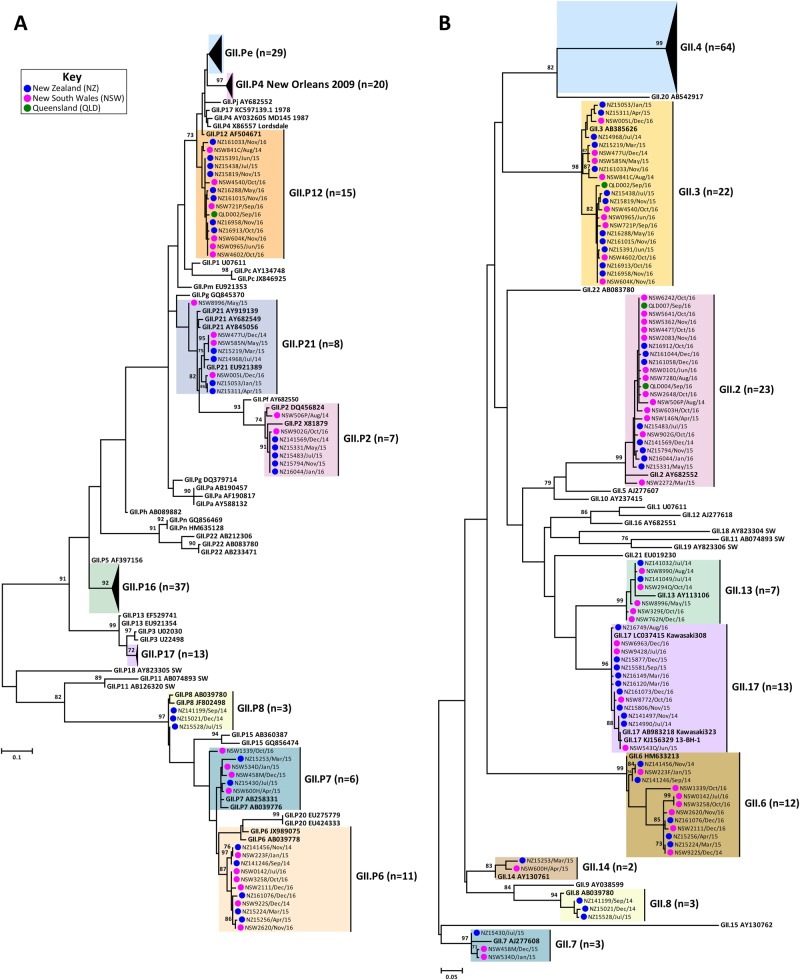
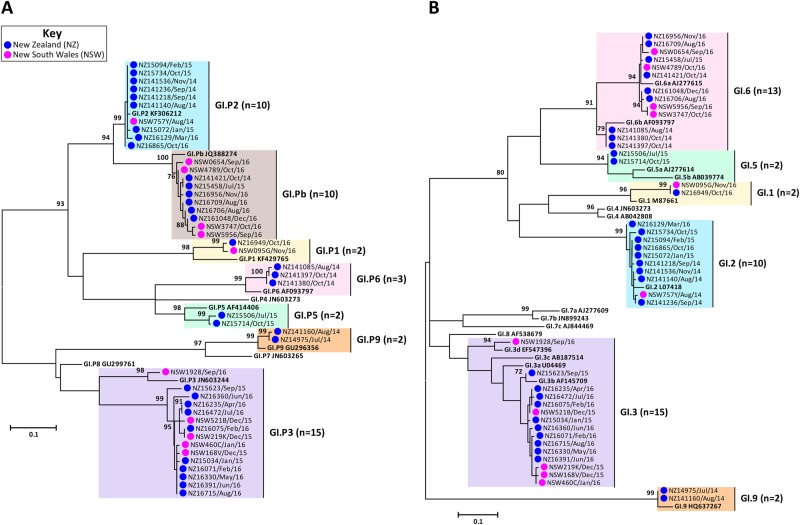
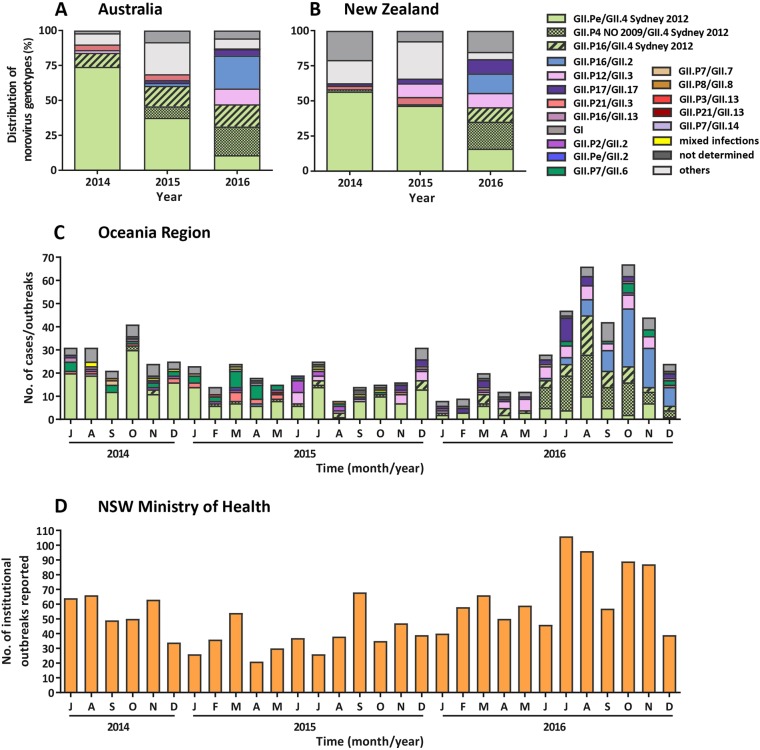
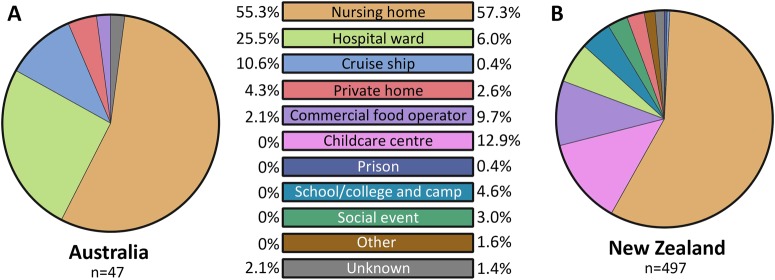
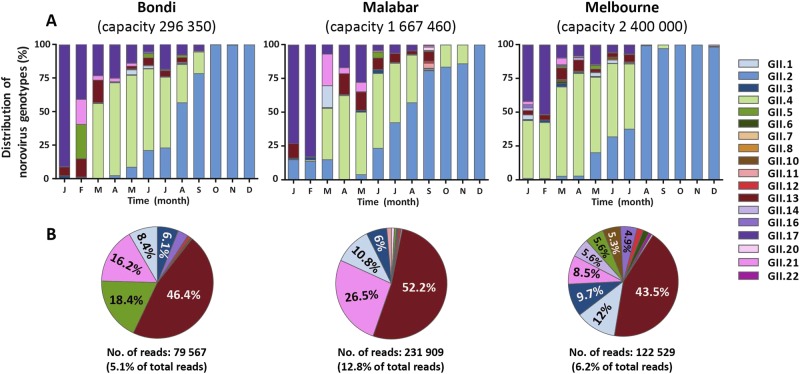
Norovirus is estimated to cause 677 million annual cases of gastroenteritis worldwide, resulting in 210,000 deaths. As viral gastroenteritis is generally self-limiting, clinical samples for epidemiological studies only partially represent circulating noroviruses in the population and is biased towards severe symptomatic cases. As infected individuals from both symptomatic and asymptomatic cases shed viruses into the sewerage system at a high concentration, waste water samples are useful for the molecular epidemiological analysis of norovirus genotypes at a population level. Using Illumina MiSeq and Sanger sequencing, we surveyed circulating norovirus within Australia and New Zealand, from July 2014 to December 2016. Importantly, norovirus genomic diversity during 2016 was compared between clinical and waste water samples to identify potential pandemic variants, novel recombinant viruses and the timing of their emergence. Although the GII.4 Sydney 2012 variant was prominent in 2014 and 2015, its prevalence significantly decreased in both clinical and waste water samples over 2016. This was concomitant with the emergence of multiple norovirus strains, including twoGII.4 Sydney 2012 recombinant viruses, GII.P4 New Orleans 2009/GII.4 Sydney 2012 and GII.P16/GII.4 Sydney 2012, along with three other emerging strains GII.17, GII.P12/GII.3 and GII.P16/GII.2. This is unusual, as a single GII.4 pandemic variant is generally responsible for 65-80% of all human norovirus infections at any one time and predominates until it is replaced by a new pandemic variant. In sumary, this study demonstrates the combined use of clinical and wastewater samples provides a more complete picture of norovirus circulating within the population.


Conflict of interest statement

JHL’s Water Research Australia scholarship was funded by Melbourne Water Corporation. In addition, this work was partly funded by Melbourne Water Corporation. All other authors declare that they have no conflict of interests.

Figures

Fig. 1
Fig. 1. Phylogenetic analysis of ORF1/ORF2 overlap region of GII norovirus.
Representative norovirus GII strains isolated in clinical samples (n = 149/686) were analysed phylogenetically. Strains analysed are denoted with a bullet (•) and colour-coded to show sample origin (pink = NSW, blue = NZ and green = QLD). Sample names contain the geographical location and time of collection. Reference strains were downloaded from GenBank and labelled with their genotype and accession number. a Phylogenetic analysis of 172 bp of the 3′-end of the polymerase gene of norovirus GII viruses. b Phylogenetic analysis of 282 bp from the 5′-end of the capsid gene of norovirus GII viruses. The scale bar indicates the number of nucleotide substitutions per site. Sequence alignments were performed using the MUSCLE algorithm. Maximum likelihood phylogenetic trees were produced with MEGA 7 software and bootstrap tests (1000 replicates) based on the Kimura two-parameter model. The bootstrap percentage values are shown at each branch point for values ≥ 70%
Fig. 2
Fig. 2. Phylogenetic analysis of ORF1/ORF2 overlap region of GI norovirus.
Representative norovirus GI strains isolated in clinical samples (n = 52/83) are shown in this phylogenetic analysis. Strains analysed in this study are denoted with a bullet (•) and colour-coded to show sample origin (pink = NSW and blue = NZ). All sample names contain the geographical location and time of collection. Reference strains were downloaded from GenBank and labelled with their genotype and accession number. Phylogenetic analysis of 172 bp of the 3′-end of the polymerase gene of norovirus GI viruses. b Phylogenetic analysis of 223 bp of the 5′-end of the capsid gene of norovirus GI viruses. The scale bar indicates the number of nucleotide substitutions per site. Sequence alignments were performed using the MUSCLE algorithm. Maximum likelihood phylogenetic trees were produced with MEGA 7 software and bootstrap tests (1000 replicates) based on the Kimura two-parameter model. The bootstrap percentage values are shown at each branch point for values ≥ 70%
Fig. 3
Fig. 3. Yearly and monthly distributions of norovirus genotypes identified in the Oceania region, compared with institutional outbreaks reported to NSW Ministry of Health between July 2014 to December 2016.
a The prevalence of norovirus genotypes identified in Australia during the study period. A total of 238 individual norovirus cases and 47 outbreaks were sequenced and genotyped from Australia (NSW, ACT and QLD). b All samples collected, sequenced and genotyped from New Zealand represented viruses from 497 separate outbreaks. Samples with unknown capsid genotypes and mixed GI/GII infections were excluded in this analysis (n = 14). c The monthly norovirus genotypic distribution for Australia and New Zealand combined throughout the study period (2014–2016) was examined. Different genotypes and GII.4 variants are colour-coded as per the legends. All norovirus GI viruses identified are grouped together under GI (dark grey) and others include all GII viruses identified (GII.P2/GII.2, GII.Pe/GII.2, GII.P7/GII.6, GII.P7/GII.7, GII.P16/GII.13 and GII.P21/GII.13) that are not indicated in the legends. d The monthly number of institutional outbreaks reported to the NSW Ministry of Health, Australia
Fig. 4
Fig. 4. Norovirus outbreak settings identified in Australia and New Zealand between July 2014 and December 2016.
The setting for norovirus outbreaks was compared between Australia and New Zealand during the study period. A total of 47 and 497 outbreaks were identified in Australia and New Zealand, respectively. An outbreak is defined as two or more cases linked by location and time
Fig. 5
Fig. 5. Simplot analysis of novel norovirus recombinant strains.
Representative sequences of emerging viruses were subjected to full-length genome sequencing and analysed using Simplot for the identification of recombination breakpoints. For all recombinant strains, a single breakpoint was identified at the ORF1/ORF2 overlap region. a Simplot for recombinant strain GII.P16/GII.4 Sydney 2012 (QLDB309/Sep/16, GenBank accession number KY905335) with a breakpoint identified at nucleotide position 5066. b Simplot for recombinant strain GII.P16/GII.2 (QLD411/Sep/16, GenBank accession number KY905336) with a breakpoint identified at nucleotide position 5062. c Simplot for recombinant GII.P4 New Orleans 2009/GII.4 Sydney 2012 (NSW789Z/Aug/16 (GenBank accession number KY905331) with a single breakpoint identified at nucleotide position 5101. d Simplot for recombinant GII.P12/GII.3 (QLDB207/Sep/16, GenBank accession number KY905334) with a breakpoint at nucleotide position was 5023. The breakpoint positions are shown by red lines. Each analysis used a window size of 300 nt and a step size of 5 nt. The reference strains used are as follows: GII.4 Syd 2012 for NSW0514/2012/AU (GenBank accession number JX459908), GII.4 NO 2009 for NSW001P/2008/AU (GenBank accession number GQ845367), GII.3 for HK71/1978/CHN (GenBank accession number JX846924), GII.12 for 04-179/2005/JP (GenBank accession number AB220922), GII.16 for Neustrelitz260/2000/DE (GenBank accession number AY772730) and GII.2 for KL109/1978/MYS (GenBank accession number JX846925)
Fig. 6
Fig. 6. Norovirus genotype distribution in wastewater samples collected from Sydney and Melbourne, 2016.
Norovirus genotypic distribution was determined in waste water samples by capsid amplicon sequencing using next-generation sequencing (NGS) technology. Samples were sequenced on the MiSeq platform and Geneious was used for merging and mapping of the reads to the reference sequences. Capsid genotypes are labelled in different colours as indicated by the legends. a The genotype distribution of norovirus capsids identified in two waste water treatment plants in Sydney (Bondi and Malabar) and one in Melbourne, Australia. The Y-axis represents the percentage norovirus distribution in each sample and the time is indicated on the X-axis. b To further investigate the less predominant capsid genotypes, the three most predominant capsid genotypes (GII.2, GII.4 and GII.17) across all sites were removed and the distribution of the remaining genotypes plotted as pie charts. The number of reads attributed to non-GII.2, GII.4 and GII.17 are listed below the pie chart

References

    1. Ogorzaly L, et al. Human adenovirus diversity in water samples using a next-generation amplicon sequencing approach. Food Environ. Virol. 2015;7:112–121. doi: 10.1007/s12560-015-9194-4. - DOI - PubMed
    1. Lodder WJ, de Roda Husman AM. Presence of noroviruses and other enteric viruses in sewage and surface waters in The Netherlands. Appl. Environ. Microbiol. 2005;71:1453–1461. doi: 10.1128/AEM.71.3.1453-1461.2005. - DOI - PMC - PubMed
    1. van den Berg H, et al. Genetic diversity of noroviruses in raw and treated sewage water. Res. Microbiol. 2005;156:532–540. doi: 10.1016/j.resmic.2005.01.008. - DOI - PubMed
    1. Pires SM, et al. Aetiology-specific estimates of the global and regional incidence and mortality of diarrhoeal diseases commonly transmitted through food. PLoS One. 2015;10:e0142927. doi: 10.1371/journal.pone.0142927. - DOI - PMC - PubMed
    1. Zheng DP, Widdowson MA, Glass RI, Vinjé J. Molecular epidemiology of genogroup II-genotype 4 noroviruses in the United States between 1994 and 2006. J. Clin. Microbiol. 2010;48:168–177. doi: 10.1128/JCM.01622-09. - DOI - PMC - PubMed

MeSH terms