. 2018 Mar 28;8(1):5341.
doi: 10.1038/s41598-018-23424-0.

Lung Topology Characteristics in patients with Chronic Obstructive Pulmonary Disease

Affiliations

Lung Topology Characteristics in patients with Chronic Obstructive Pulmonary Disease

Francisco Belchi et al. Sci Rep. .

Abstract

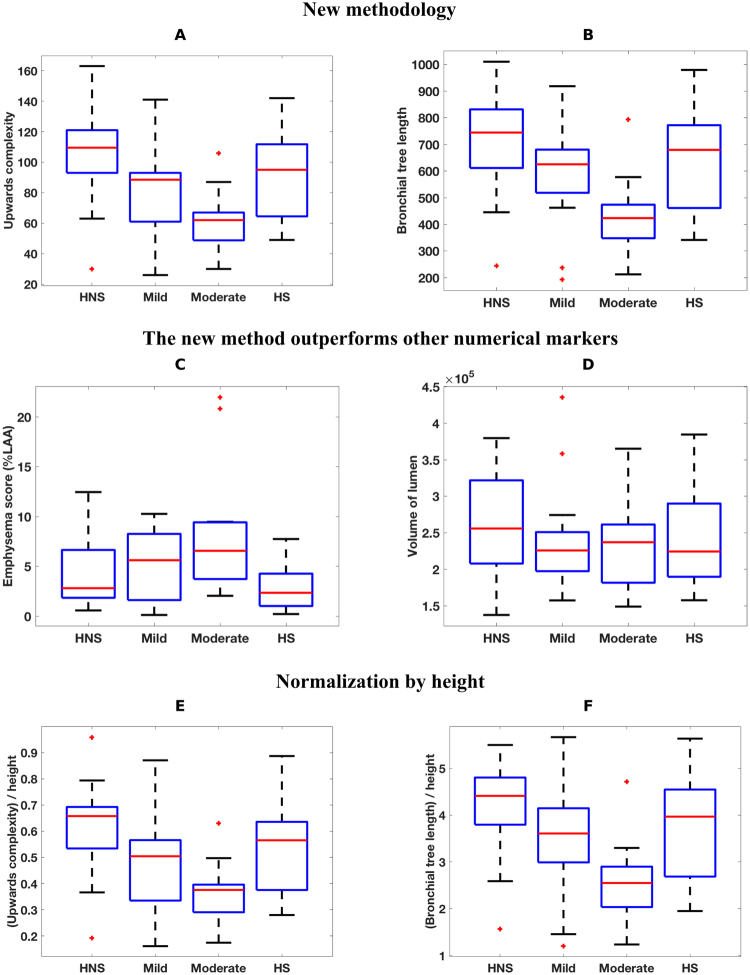
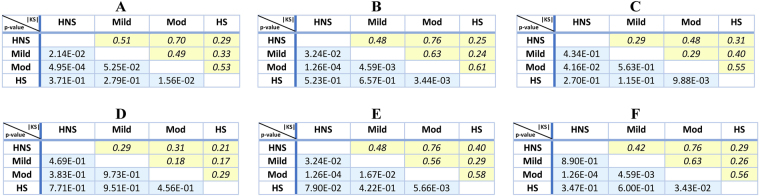
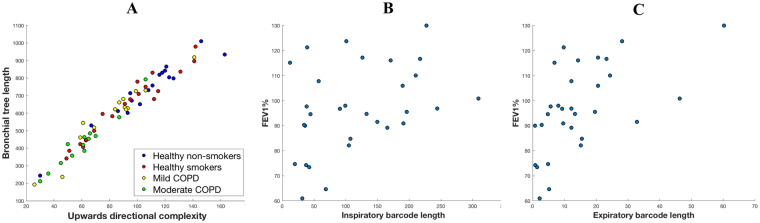
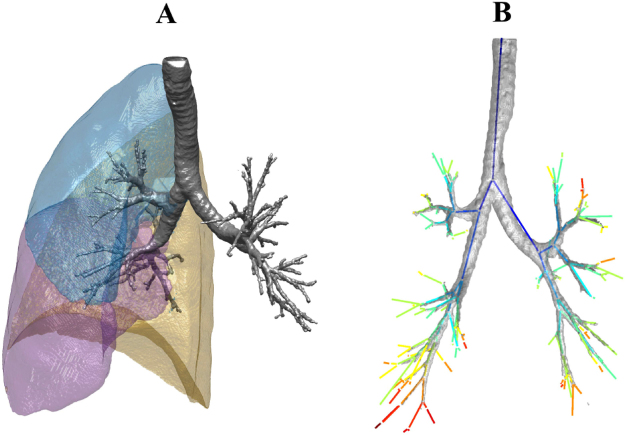
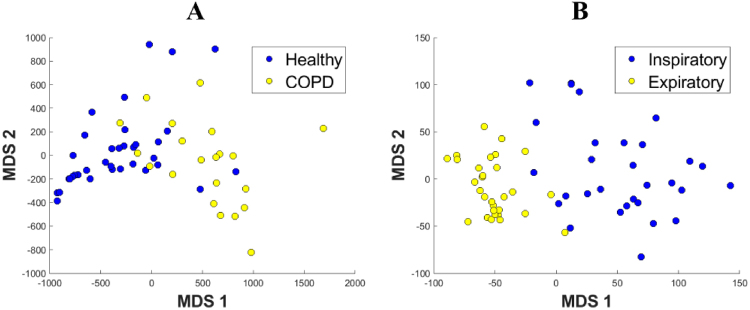
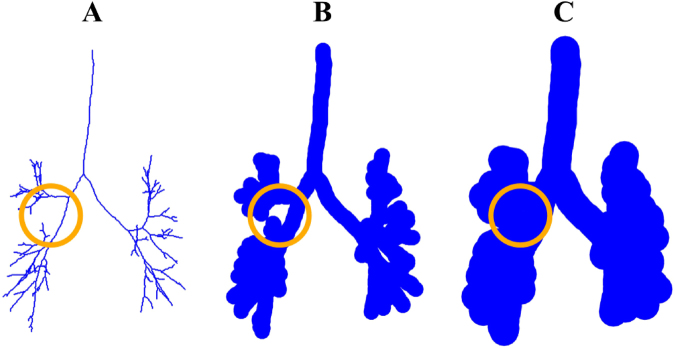
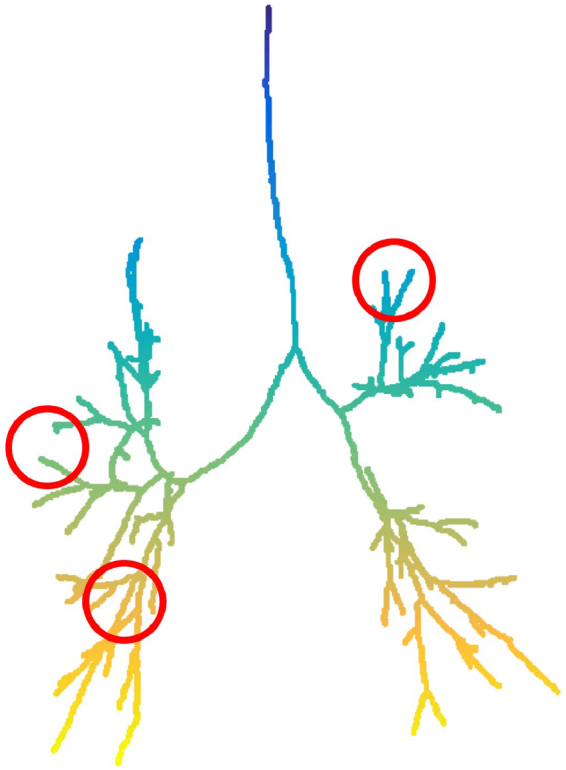
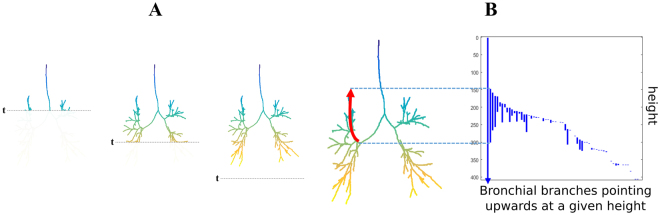
Quantitative features that can currently be obtained from medical imaging do not provide a complete picture of Chronic Obstructive Pulmonary Disease (COPD). In this paper, we introduce a novel analytical tool based on persistent homology that extracts quantitative features from chest CT scans to describe the geometric structure of the airways inside the lungs. We show that these new radiomic features stratify COPD patients in agreement with the GOLD guidelines for COPD and can distinguish between inspiratory and expiratory scans. These CT measurements are very different to those currently in use and we demonstrate that they convey significant medical information. The results of this study are a proof of concept that topological methods can enhance the standard methodology to create a finer classification of COPD and increase the possibilities of more personalized treatment.


Conflict of interest statement

The authors declare no competing interests.

Figures

Figure 1
Figure 1
Differences between severity groups given by 6 radiomic features. In the boxplots, HNS = healthy non-smokers, Mild = mild COPD patients, Mod = moderate COPD patients and HS = healthy smokers. The + signs denote outliers. The 6 radiomic features studied are (A) upwards complexity (see Methods for details), (B) bronchial tree length, (C) emphysema score (as percentage of low attenuation area), (D) volume of the airways (computed as the number of voxels inside the grey airway structure in Fig. 4A), (E) upwards complexity divided by participant’s height, (F) bronchial tree length divided by participant’s height. The combination of radiomic features A and B can distinguish all groups except for HS from HNS or from Mild, which outperforms the combination of methods C and D.
Figure 2
Figure 2
Differences between severity groups given by 6 radiomic features. For each radiomic feature, we show the table with the pairwise Kolmogorov-Smirnov that compares HNS = healthy non-smokers, Mild = mild COPD patients, Mod = moderate COPD patients and HS = healthy smokers. The values in italics in yellow shaded boxes indicate the absolute value of the KS score and the values in roman type in blue shaded boxes indicate p-values. The 6 radiomic features analyzed are (A) upwards complexity (see Methods for details), (B) bronchial tree length, (C) emphysema score (as percentage of low attenuation area), (D) volume of the airways (computed as the number of voxels inside the airway structure in Fig. 4A), (E) upwards complexity divided by participant’s height, (F) bronchial tree length divided by participant’s height. The combination of radiomic features A and B can distinguish all groups except for HS from HNS or from Mild, which outperforms the combination of methods C and D.
Figure 3
Figure 3
Analysis of topological characteristics. (A) Correlation between upwards complexity and bronchial tree length (Pearson correlation coefficient ρ = 0.97, p-value ρ = 1.56.10−41). Similar results were obtained using directional complexity in other directions. (B) Correlation between the inspiratory branch-to-branch proximity, which quantifies how branches of the inspiratory bronchial tree bend towards one another, and FEV1 (% of predicted) (ρ = 0.38, ρ = 0.040). (C) Expiratory counterpart of (b) (ρ = 0.57, ρ = 0.001). Notice that the correlation is stronger and more significant for expiratory scans than for inspiratory scans.
Figure 4
Figure 4
MSCT analysis. (A) The Apollo software (Vida Diagnostics, Iowa, USA) was used to segment the lobes from the MSCT scans. The resulting contour of the right lung lobes is presented here using custom software written in Matlab (R2015b, MathWorks, Natick, MA 01760–2098, US). (B) Illustration of the extracted branch center lines, along with the segmented airway tree for one of the participants. The center lines are colored according to generation number. Note that for the purposes of illustration, the center lines are plotted between the branch points only. For all of the analysis described in this paper, the complete center line information was used, which captured the true shape of the airways as in Fig. 8.
Figure 5
Figure 5
Spatial representation of similarities between lungs. These are obtained by describing the shape of each lung through a set of topological characteristics called barcodes (see Methods for details) and computing distances between the barcodes of individual subjects. The resulting space is represented in 2D through an MDS embedding. In the legends, Healthy = healthy smokers and non-smokers, COPD = mild and moderate COPD patients. (A) This representation uses degree-2 persistent homology of inspiratory data to infer the shape of the airways inside the cavity of the lobes and it shows a clear distinction between Healthy and COPD groups. The overlap between the groups suggests that our characteristics are on a continuous spectrum. The presence of two nominally healthy cases so deep in the COPD region suggests a potential undiagnosed problem. Interestingly enough, those two individuals were healthy smokers. Similarly, all 6 COPD points which lie in or just outside the healthy region correspond to mild COPD patients. (B) This representation takes into account how the airways bend upwards and shows that this topological feature clearly separates the inspiratory and expiratory stages of the bronchial tree. This analysis was not performed for the expiratory phase because the information about the lobe structure was not available.
Figure 6
Figure 6
Computing of branch-to-branch proximity. Consider the graph representing the bronchial tree as explained in Methods (A). This graph is called a tree since it contains no loops, i.e., no branches that bifurcate and then merge. Of note, there are many nodes (up to 264) between any two consecutive bifurcations, so the nodes appear dense in the graph representation. Centered at each node of this graph, we virtually set a ball of a fixed radius, thickening the construction. As we keep thickening more and more, by increasing the radius of those balls, at some point we will find that some branches merge, creating a loop (B). We record the radius r1 at which this happens. For a large enough radius r2, though, this loop will be filled in (C). If a merging of branches creates a loop that appears for the value r1 of the radius and disappears at r2, we represent this merging as the positive number r2 − r1. Summing up all these terms, we obtain a number we call branch-to-branch proximity.
Figure 7
Figure 7
Calculations show that the lung function is better when more branches bend towards one another in the expiratory bronchial tree (such as the branches in the two circles on the left, in contrast with those in the circle on the right). See Fig. 3C.
Figure 8
Figure 8
Explanation of upwards complexity. The color gradient indicates height. (A) To study upwards complexity, we slide a horizontal plane downwards. If we denote by Xh the part of the tree that sits above the horizontal plane at distance h from the top of the image, then XhXh' whenever hh, obtaining a sequence of nested graphs approximating the bronchial tree more accurately as we increase h. (B) The right part of the panel shows the degree-0 barcode of the sequence of nested graphs in (A). In this picture, the correspondence between bars in the barcode and branches that change trajectory upwards becomes apparent. In particular, the length of a bar indicates for how long a branch follows that upwards trajectory.

References

    1. Mathers CD, Loncar D. Projections of Global Mortality and Burden of Disease from 2002 to 2030. PLoS Medicine. 2006;3(11):e442. doi: 10.1371/journal.pmed.0030442. - DOI - PMC - PubMed
    1. Lozano R, et al. Global and regional mortality from 235 causes of death for 20 age groups in 1990 and 2010: a systematic analysis for the Global Burden of Disease Study 2010. The Lancet. 2012;380(9859):2095–2128. doi: 10.1016/S0140-6736(12)61728-0. - DOI - PMC - PubMed
    1. Coxson HO, Leipsic J, Parraga G, Sin DD. Using Pulmonary Imaging to Move Chronic Obstructive Pulmonary Disease beyond FEV1. American Journal of Respiratory and Critical Care Medicine. 2014;190:135–144. doi: 10.1164/rccm.201402-0256PP. - DOI - PubMed
    1. Doherty DE. A Review of the Role of FEV1in the COPD Paradigm. COPD: Journal of Chronic Obstructive Pulmonary Disease. 2008;5:310–318. doi: 10.1080/15412550802363386. - DOI - PubMed
    1. Jones PW. Health Status and the Spiral of Decline. COPD: Journal of Chronic Obstructive Pulmonary Disease. 2009;6:59–63. doi: 10.1080/15412550802587943. - DOI - PubMed

Publication types

MeSH terms