Automated brightfield morphometry of 3D organoid populations by OrganoSeg
- PMID: 29593296
- PMCID: PMC5871765
- DOI: 10.1038/s41598-017-18815-8
Automated brightfield morphometry of 3D organoid populations by OrganoSeg
Abstract
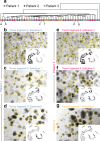
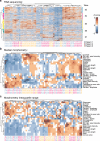
Spheroid and organoid cultures are powerful in vitro models for biology, but size and shape diversity within the culture is largely ignored. To streamline morphometric profiling, we developed OrganoSeg, an open-source software that integrates segmentation, filtering, and analysis for archived brightfield images of 3D culture. OrganoSeg is more accurate and flexible than existing platforms, and we illustrate its potential by stratifying 5167 breast-cancer spheroid and 5743 colon and colorectal-cancer organoid morphologies. Organoid transcripts grouped by morphometric signature heterogeneity were enriched for biological processes not prominent in the original RNA sequencing data. OrganoSeg enables complete, objective quantification of brightfield phenotypes, which may give insight into the molecular and multicellular mechanisms of organoid regulation.
Conflict of interest statement
The authors declare no competing interests.
Figures


Similar articles
-
A Bioinformatic Profile of Gene Expression of Colorectal Carcinoma Derived Organoids.Biomed Res Int. 2018 Sep 27;2018:2594076. doi: 10.1155/2018/2594076. eCollection 2018. Biomed Res Int. 2018. PMID: 30363662 Free PMC article.
-
AnaSP: a software suite for automatic image analysis of multicellular spheroids.Comput Methods Programs Biomed. 2015 Apr;119(1):43-52. doi: 10.1016/j.cmpb.2015.02.006. Epub 2015 Feb 24. Comput Methods Programs Biomed. 2015. PMID: 25737369
-
OrgaQuant: Human Intestinal Organoid Localization and Quantification Using Deep Convolutional Neural Networks.Sci Rep. 2019 Aug 28;9(1):12479. doi: 10.1038/s41598-019-48874-y. Sci Rep. 2019. PMID: 31462669 Free PMC article.
-
Mammary Organoids and 3D Cell Cultures: Old Dogs with New Tricks.J Mammary Gland Biol Neoplasia. 2020 Dec;25(4):273-288. doi: 10.1007/s10911-020-09468-x. Epub 2020 Nov 18. J Mammary Gland Biol Neoplasia. 2020. PMID: 33210256 Review.
-
Modeling neoplastic disease with spheroids and organoids.J Hematol Oncol. 2020 Jul 16;13(1):97. doi: 10.1186/s13045-020-00931-0. J Hematol Oncol. 2020. PMID: 32677979 Free PMC article. Review.
Cited by
-
Patient-derived cancer organoid tracking with wide-field one-photon redox imaging to assess treatment response.J Biomed Opt. 2021 Mar;26(3):036005. doi: 10.1117/1.JBO.26.3.036005. J Biomed Opt. 2021. PMID: 33754540 Free PMC article.
-
OrgDyn: feature- and model-based characterization of spatial and temporal organoid dynamics.Bioinformatics. 2020 May 1;36(10):3292-3294. doi: 10.1093/bioinformatics/btaa096. Bioinformatics. 2020. PMID: 32091578 Free PMC article.
-
Volumetric growth tracking of patient-derived cancer organoids using optical coherence tomography.Biomed Opt Express. 2021 Jun 3;12(7):3789-3805. doi: 10.1364/BOE.428197. eCollection 2021 Jul 1. Biomed Opt Express. 2021. PMID: 34457380 Free PMC article.
-
Engineered organoids for biomedical applications.Adv Drug Deliv Rev. 2023 Dec;203:115142. doi: 10.1016/j.addr.2023.115142. Epub 2023 Nov 13. Adv Drug Deliv Rev. 2023. PMID: 37967768 Free PMC article. Review.
-
Development of a deep learning based image processing tool for enhanced organoid analysis.Sci Rep. 2023 Nov 13;13(1):19841. doi: 10.1038/s41598-023-46485-2. Sci Rep. 2023. PMID: 37963925 Free PMC article.
References
Publication types
MeSH terms
Grants and funding
LinkOut - more resources
Full Text Sources
Other Literature Sources

