. 2018 Mar 28;9(1):1241.
doi: 10.1038/s41467-018-03584-3.

Oncofetal gene SALL4 reactivation by hepatitis B virus counteracts miR-200c in PD-L1-induced T cell exhaustion

Affiliations

Oncofetal gene SALL4 reactivation by hepatitis B virus counteracts miR-200c in PD-L1-induced T cell exhaustion

Cheng Sun et al. Nat Commun. .

Abstract

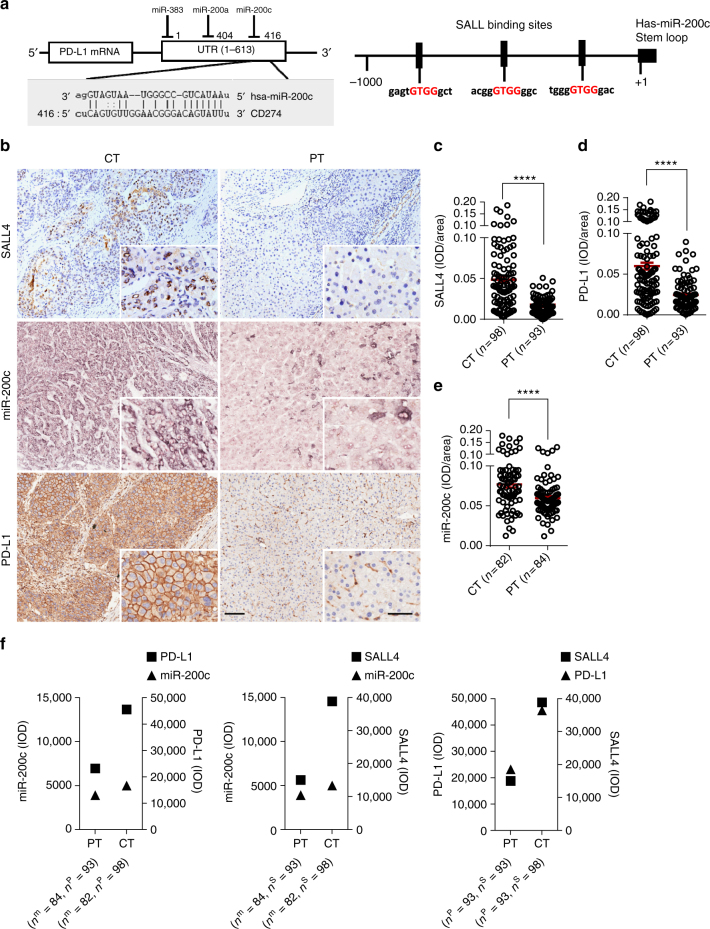
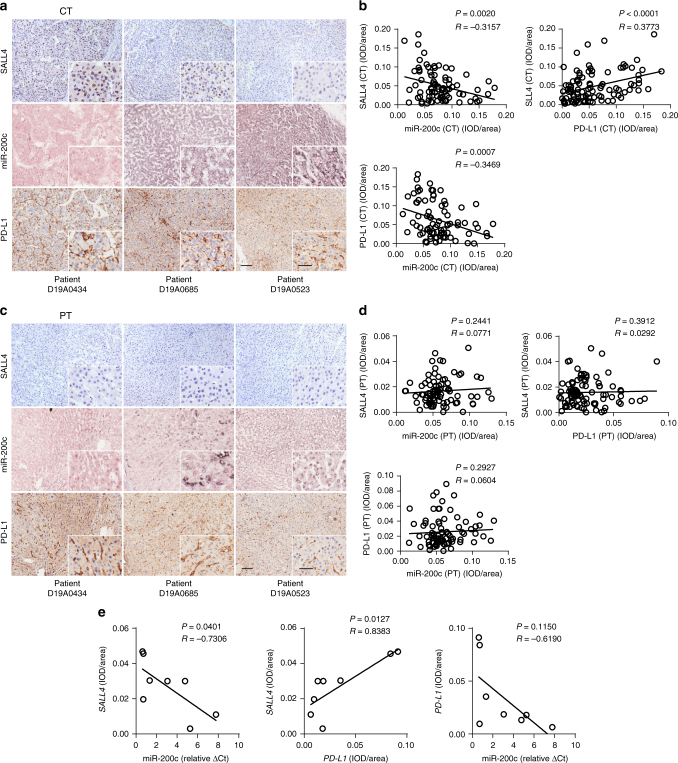
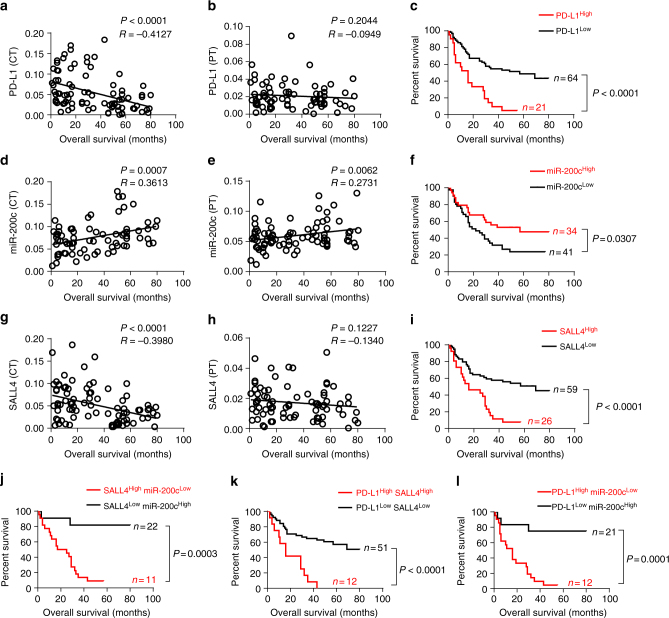
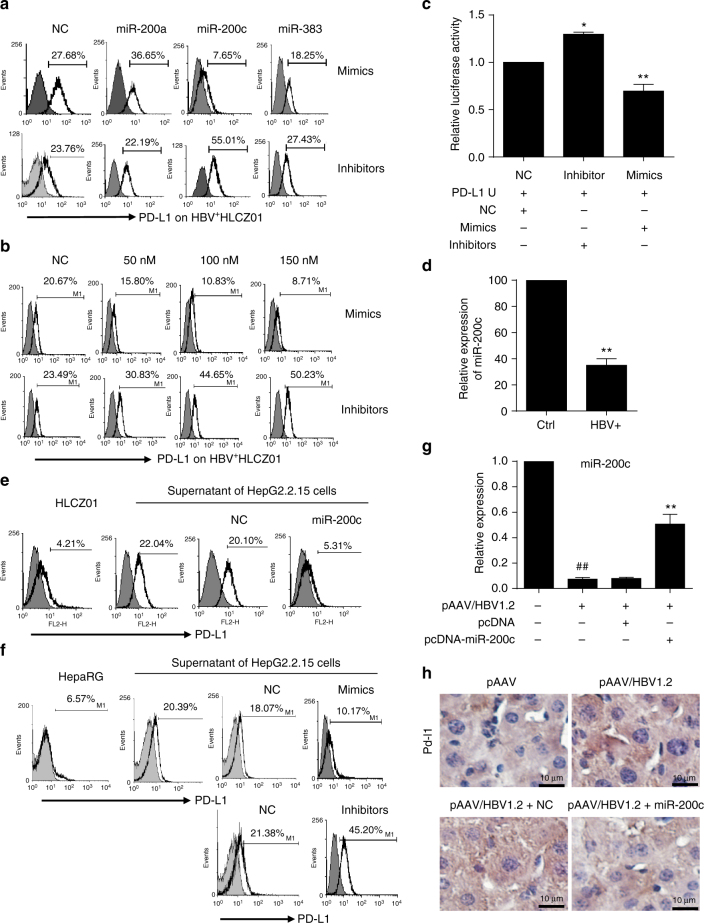
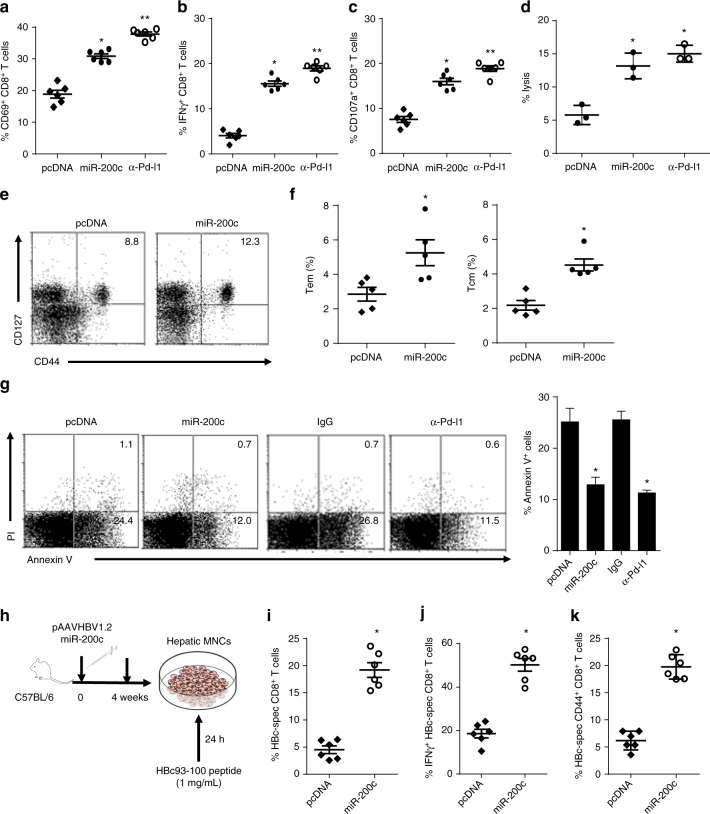
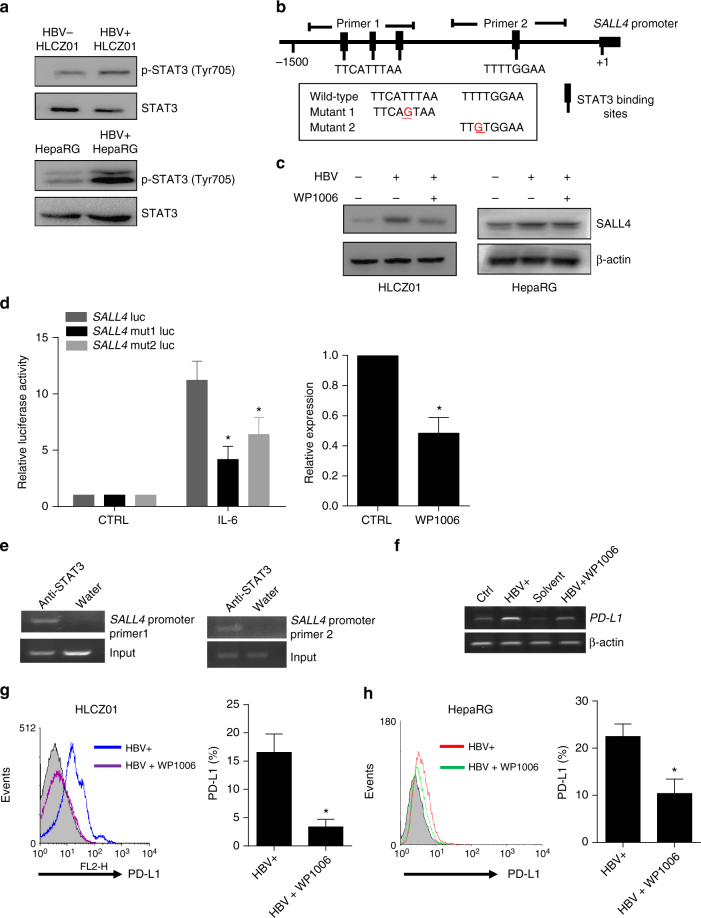
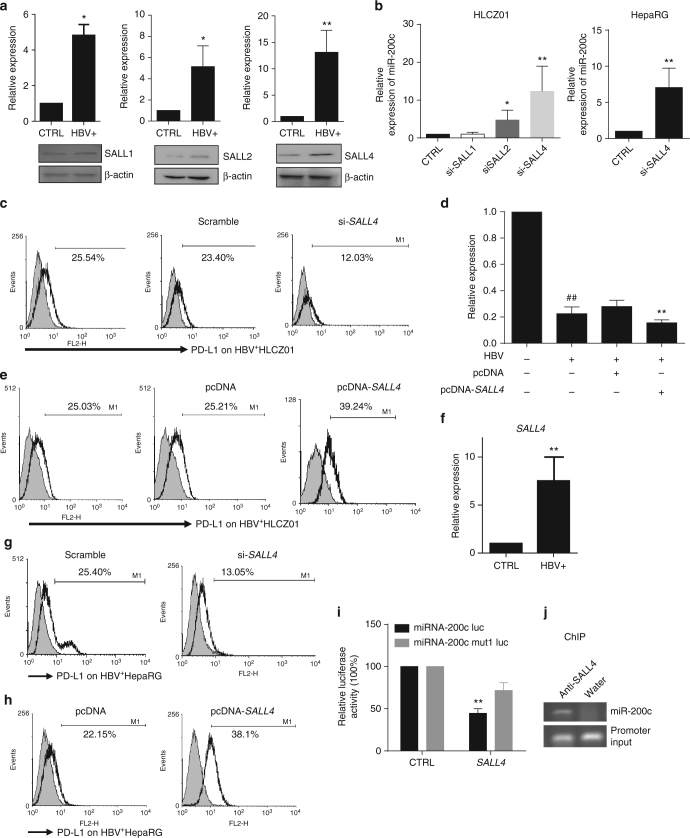
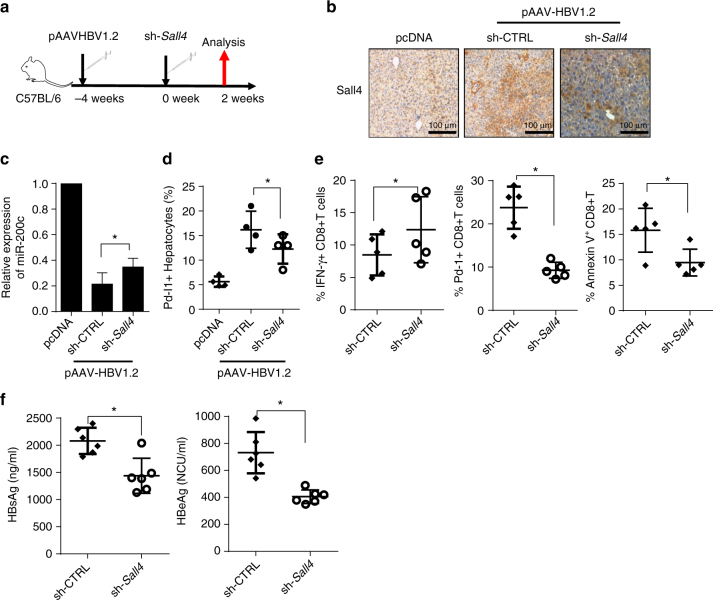
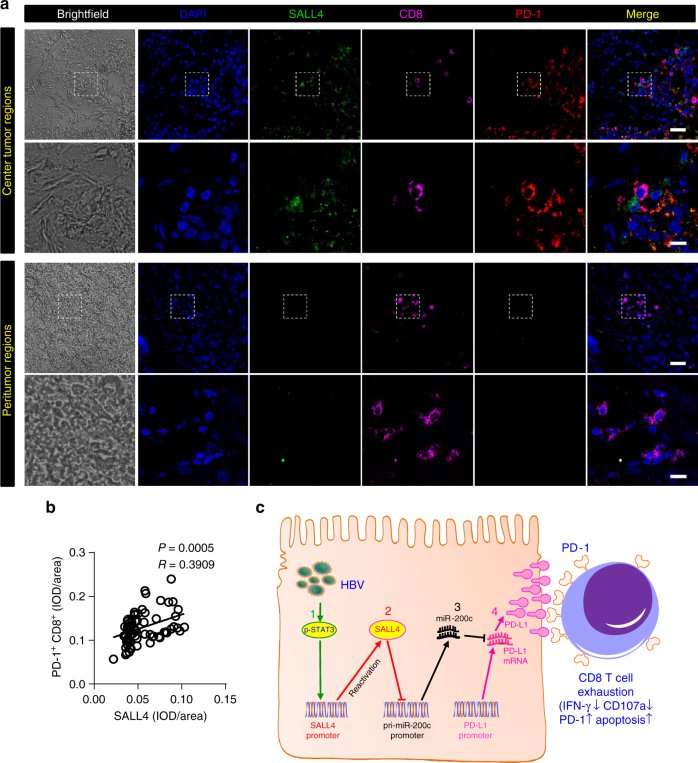
A chronic viral or tumor microenvironment can push T cells to exhaustion by promoting coinhibitory ligand expression. However, how host factors control coinhibitory ligand expression and whether viral infection breaks this control during tumor progress is unknown. Here we show a close negative correlation between SALL4 or PD-L1 and miR-200c in tumors from 98 patients with HBV-related hepatocellular carcinoma. SALL4 or PD-L1 expression correlates negatively with miR-200c expression, and patients with lower levels of SALL4 or PD-L1 and higher miR-200c survive longer. Moreover, over-expression of miR-200c antagonizes HBV-mediated PD-L1 expression by targeting 3'-UTR of CD274 (encoding PD-L1) directly, and reverses antiviral CD8+ T cell exhaustion. MiR-200c transcription is inhibited by oncofetal protein SALL4, which is re-expressed through HBV-induced STAT3 activation in adulthood. We propose that an HBV-pSTAT3-SALL4-miR-200c axis regulates PD-L1. Therapeutic strategies to influence this axis might reverse virus-induced immune exhaustion.


Conflict of interest statement

The authors declare no competing interests.

Figures

Fig. 1
Fig. 1
Expression of SALL4, miR-200c, and PD-L1 in the center tumor regions of HCC. a Predicted microRNA targeting PD-L1 3´-UTR includes miR-200a, miR-200c, and miR-383 (left); the upstream promoter region of the human miR-200c showing putative SALL4-binding sites (right). b Immunostaining of SALL4 and PD-L1 proteins (brown color) and in situ hybridization for hsa-miR-200c (blue purple color) in the center of the tumor (CT) and peritumor (PT) regions of HCC. Original magnifications: × 10, × 20; bar = 100 µm, 50 µm, respectively. ce Increased SALL4 (c, P < 0.0001), PD-L1 (d, P < 0.0001) and miR-200c expression (e, P < 0.0001) in CT regions. Cumulative data calculated by two-tailed unpaired Student’s t-test. The results are expressed as the mean ± SEM. ****P < 0.0001. f Disparity analysis between miR-200c and PD-L1 (left), miR-200c and SALL4 (middle), PD-L1 and SALL4 (right) in CT and PT regions. nP, number of patients with PD-L1; nm, number of patients with miR-200c; nS, number of patients with SALL4
Fig. 2
Fig. 2
Correlations among SALL4, miR-200c, and PD-L1 in the center tumor regions of HCC. a, c Immunostaining of SALL4 and PD-L1 proteins and miR-200c in situ hybridization in the center tumor a and peritumor c regions of three representative HCC patients. Original magnifications: × 10, × 20; bar = 100 µm, 50 µm, respectively. b, d Pearson correlation analysis between the expression (IOD/area) of SALL4, PD-L1 and miR-200c in center tumor (b) and peritumor (d) regions of HCC. e Correlation analysis between SALL4 and miR-200c (Relative ΔCt) (left), SALL4 and PD-L1 (middle), and PD-L1 and miR-200c (right), from eight fresh tissue HCC samples. Spearman’s correlation coefficients and P values are shown
Fig. 3
Fig. 3
Increased overall survival in patients with lower SALL4, higher miR-200c and lower PD-L1. a, b Correlation of PD-L1 expression in the center tumor and peritumor regions to overall survival (OS). c OS in patients with PD-L1 expression in the center tumor regions (log-rank test). d, e Correlation of miR-200c expression in center tumor and peritumor regions to OS. f OS in patients with miR-200c expression in the center tumor regions (log-rank test). g, h Correlation of SALL4 expression in the center tumor and peritumor regions to OS. i OS in patients with SALL4 expression in center tumor regions (log-rank test). jl OS in patients concurrently with SALL4 and miR-200c, or SALL4 and PD-L1, or miR-200c and PD-L1 (log-rank test). Pearson’s correlation coefficients (r) and P values are shown in Fig. a, b, d, e, g, and h
Fig. 4
Fig. 4
miR-200c down-regulates PD-L1 on hepatoma cells. a PD-L1 expression on human HBV+ hepatoma cells. 50 nM miR-200a, miR-200c, and miR-383 mimics or inhibitors were transfected into HBV+HLCZ01 cells; 24 h later, PD-L1 was detected by FACS. b Indicated doses of miR-200c mimics and inhibitors were transfected into HBV+HLCZ01 cells; 24 h later, PD-L1 was detected by FACS. c HBV+HLCZ01 cells were transfected with pMIR-Reporter-PD-L1-3´-UTR and pRL-TK, together with 100 nM of miR-200c mimics, inhibitors, or NC for 36 h. Renilla luciferase activity was normalized to Firefly luciferase activity. d Relative expression of miR-200c in HLCZ01 and HBV+HLCZ01 cells. e PD-L1 expression after miR-200c or NC was transfected into HBV+HLCZ01 cells by FACS. f miR-200c mimics and inhibitors were transfected into HBV+HepaRG cells; 24 h later, PD-L1 was detected by FACS. g Influence of HBV in miR-200c expression in HBV-persistent mice. pAAV/HBV1.2 plasmid together with pcDNA-miR-200c or pcDNA-empty was hydrodynamically injected into C57BL/6 mice; four weeks later, miR-200c expression in hepatocytes was detected by q-RT-PCR. h Influence of miR-200c in Pd-l1 expression in liver tissue of HBV-persistent mice. Pd-l1 was analyzed by IHC. Data are representative results from three independent experiments. Significant differences calculated using unpaired two-tailed Student’s t-tests. *P < 0.05, **P < 0.01, versus NC or HBV- control (c, d); ##P < 0.01, versus HBV mice. **P < 0.01, versus pAAV/HBV1.2 with or without pcDNA injection (g)
Fig. 5
Fig. 5
miR-200c reverses CD8+T cell exhaustion in HBV-persistent mice. a, b Activation and IFN-γ-producing CD8+ T cells in HBV-persistent mice by miR-200c over-expression. Plasmids containing pAAV/HBV1.2, together with plasmids containing pcDNA-miR-200c or pcDNA, were hydrodynamically injected into C57BL/6 mice, or treated with anti-Pd-1 Ab, respectively; four weeks later, percentages of CD69+CD8+ and IFN-γ+CD8+ T cells in all CD8+ T cells were detected by FACS. c, d Cytolytic function of CD8+T cells in HBV-persistent mice by miR-200c over-expression. Percentages of CD107a+CD8+ T cells in all CD8+ T cells and cytolysis by CD8+T cells were detected by FACS. e, f Memory CD8+ T cell in HBV-persistent mice by miR-200c over-expression. CD44+CD127+memory CD8+ T cells, CD44hiCD62Llow effector CD8+ T cells (Tem) and CD44hiCD62Lhi central memory CD8+ T cells (Tcm) in total CD8+ T cells were detected by FACS. g The apoptosis of CD8+ T cells was analyzed by double staining of Annexin V and PI. hk Hepatic CD8+T cells from HBV-persistent mice in response to HBc93-100 stimulation in vitro. Hepatic lymphocytes from HBV-persistent mice, treated with or without miR-200c over-expression as above, were separated and stimulated with HBc93-100 peptide-loaded monocytes (1 mg/mL) for 24 h. The percentages of HBc-specific CD8+ T cells (i) and HBc-specific IFN-γ+CD8+ T cells in total CD8+ T cells (j), and HBc-specific CD44+CD127+memory CD8+ T cells (k) were detected by FACS. Data are representative of three independent experiments with six mice per group. Significant differences calculated using unpaired two-tailed Student’s t-tests. *P < 0.05, **P < 0.01, versus pcDNA control
Fig. 6
Fig. 6
HBV triggers SALL4 expression via STAT3 activation. a STAT3 activation was assayed in HBV- and HBV+ Hepatoma cells. HBV-infected or uninfected HLCZ01 (HBV+HLCZ01 and HLCZ01) cells, and HBV+HepaRG cells and HepaRG were used to detect STAT3 activation by western blot. b Upstream promoter region of the human SALL4 showing putative STAT3-binding sites. A schematic diagram of the -1500/ + 20 human SALL4-luciferase construct is shown, and the sequence of the point mutations also indicated. Schematic representative primer 1 and primer 2 specific for the SALL4 promoter used in this study were indicated. c SALL4 protein was determined in HBV+HLCZ01 cells and HBV+HepaRG cells treated with/without STAT3 inhibitor WP1006. d HBV+HLCZ01 cells were transfected with reporter plasmids containing SALL4 promoter or SALL4 mutant (mut 1 and mut 2), together with IL-6 or WP1006 treatment. The Renilla luciferase activity was normalized to Firefly luciferase activity. e ChIP with STAT3 antibody shows binding of STAT3 to the SALL4 promoter in HBV-infected HLCZ01 cells. f, g HBV+HLCZ01 cells were treated with/without STAT3 inhibitor WP1006; 24 h later, the mRNA level (f) and surface protein expression (g) of PD-L1 were determined via q-RT-PCR and FACS, respectively. h HBV+HepaRG cells were treated with/without STAT3 inhibitor WP1006; 24 h later, surface protein expression of PD-L1 was determined via FACS. Data are representative of three independent experiments. Significant differences calculated using unpaired two-tailed Student’s t-tests. *P < 0.05
Fig. 7
Fig. 7
HBV-STAT3-SALL4 axis inhibits miR-200c transcription. a The mRNA and protein levels of SALL1, SALL2 and SALL4 of HBV+HLCZ01 cells were determined by q-RT-PCR (upper) and western Blot (below). b miR-200c expression was determined in HBV+HLCZ01 cells transfected with si-SALL1, si-SALL2, and si-SALL4 (left), miR-200c expression was determined in HBV+HepaRG cells transfected with si-SALL4 (right). c PD-L1 expression was assayed by FACS in HBV+HLCZ01 cells transfected with si-SALL4. d miR-200c expression was determined in HBV+HLCZ01 cells transfected with SALL4 over-expressing vector. e PD-L1 expression was assayed in SALL4 over-expressed HBV+HLCZ01 cells. f The mRNA level of SALL4 in HBV+HepaRG cells was determined by q-RT-PCR. g PD-L1 expression was assayed by FACS in HBV+HepaRG cells transfected with si-SALL4. h PD-L1 expression was assayed by FACS in HBV+HepaRG cells transfected with SALL4 over-expressing vector. i The activity of the miR-200c promoter reporter was assayed. j ChIP with SALL4 antibody showed binding of SALL4 to the miR-200c promoter in the HBV-infected H LCZ01 cells. Data are representative of three independent experiments. Significant differences calculated using unpaired two-tailed Student’s t-tests. *P < 0.05, **P < 0.01
Fig. 8
Fig. 8
Silence of SALL4 hinders HBV persistence through miR-200c-PD-L1-T cell exhaustion. a Protocol of Sall4 silence in HBV-persistent mice. pAAV/HBV1.2 was injected into C57BL/6 mice, and four weeks later, sh-Sall4 or sh-ctrl was hydrodynamically injected into HBV-persistent mice, and then analyzed two weeks later. b The protein levels of Sall4 in liver were detected by IHC in HBV-persistent mice after sh-Sall4 treatment. c miR-200c expression was determined by q-RT-PCR in primary hepatocytes from Sall4-silenced HBV-persistent mice. d Pd-l1 expression was assayed by FACS in the same cells as above. e The percentage of IFN-γ-, Pd-1-, and Annexin V-positive CD8+T cells was determined from liver of Sall4-silenced HBV-persistent mice. f The serum levels of HBsAg and HBeAg in Sall4-silenced HBV-persistent mice were detected by ELISA. Data are representative of three independent experiments. Significant differences calculated using unpaired two-tailed Student’s t-tests. *P < 0.05
Fig. 9
Fig. 9
Positive correlation between SALL4 expression and tumor infiltrating PD-1+CD8+T cells in HCC. a Confocal immunofluorescence images of SALL4 (green), CD8 (magenta) and PD-1 (red) staining in the center tumor (top 2 row) and peritumor (bottom 2 row) regions of HCC. Original magnifications: × 20, × 63; scale bar represents 50 μm and 10 μm, respectively. b Correlation between the expression of SALL4 and PD-1+CD8+ cells in the center tumor regions of 75 confocal images from12 fresh tissue samples of HCC patients. Each patient has been taken more than six random perspectives. Pearson’s correlation coefficients and P values are shown. c The proposed model of HBV-pSTAT3-SALL4-miR-200c-PD-L1-T cell exhaustion axis. miR-200c is an intrinsic regulator to directly inhibit PD-L1 expression; however, HBV could suppress miR-200c transcription via reactivating oncofetal protein SALL4, a transcriptional repressor, up-regulated by HBV-induced STAT3 activation, eventually leading to higher expression of PD-L1 and subsequent CD8+ T cell exhaustion

Similar articles

Cited by

References

    1. Fridman WH, Pages F, Sautes-Fridman C, Galon J. The immune contexture in human tumours: impact on clinical outcome. Nat. Rev. Cancer. 2012;12:298–306. doi: 10.1038/nrc3245. - DOI - PubMed
    1. Shuai Z, et al. Adaptive immunity in the liver. Cell. Mol. Immunol. 2016;13:354–368. doi: 10.1038/cmi.2016.4. - DOI - PMC - PubMed
    1. Horst AK, Neumann K, Diehl L, Tiegs G. Modulation of liver tolerance by conventional and nonconventional antigen-presenting cells and regulatory immune cells. Cell. Mol. Immunol. 2016;13:277–292. doi: 10.1038/cmi.2015.112. - DOI - PMC - PubMed
    1. Robinson MW, Harmon C, O’Farrelly C. Liver immunology and its role in inflammation and homeostasis. Cell. Mol. Immunol. 2016;13:267–276. doi: 10.1038/cmi.2016.3. - DOI - PMC - PubMed
    1. Keir ME, Butte MJ, Freeman GJ, Sharpe AH. PD-1 and its ligands in tolerance and immunity. Annu Rev. Immunol. 2008;26:677–704. doi: 10.1146/annurev.immunol.26.021607.090331. - DOI - PMC - PubMed

Publication types

MeSH terms