. 2018 Mar 28;8(1):5314.
doi: 10.1038/s41598-018-22488-2.

Profiles of miRNA Isoforms and tRNA Fragments in Prostate Cancer

Affiliations

Profiles of miRNA Isoforms and tRNA Fragments in Prostate Cancer

Rogan G Magee et al. Sci Rep. .

Abstract

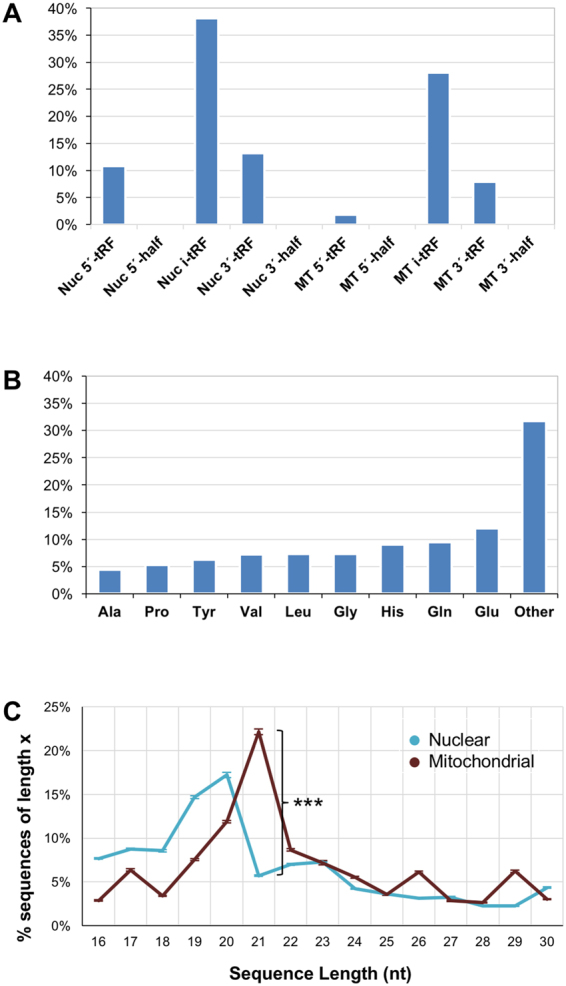
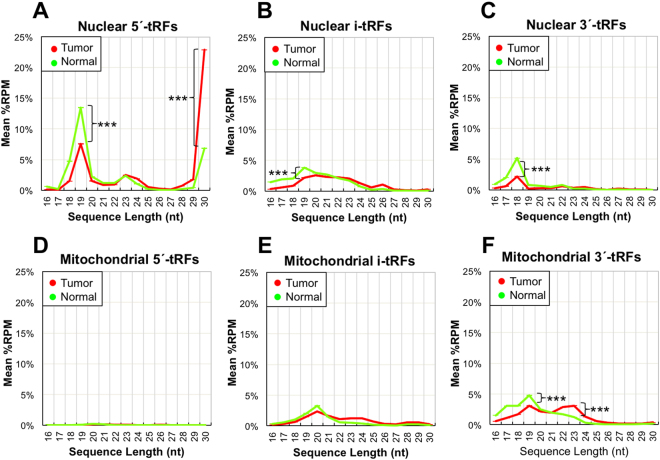
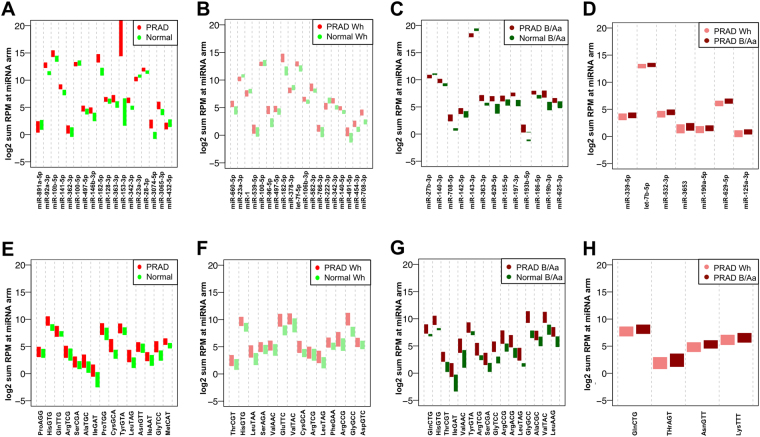
MicroRNA (miRNA) isoforms ("isomiRs") and tRNA-derived fragments ("tRFs") are powerful regulatory non-coding RNAs (ncRNAs). In human tissues, both types of molecules are abundant, with expression patterns that depend on a person's race, sex and population origin. Here, we present our analyses of the Prostate Cancer (PRAD) datasets of The Cancer Genome Atlas (TCGA) from the standpoint of isomiRs and tRFs. This study represents the first simultaneous examination of isomiRs and tRFs in a large cohort of PRAD patients. We find that isomiRs and tRFs have extensive correlations with messenger RNAs (mRNAs). These correlations are disrupted in PRAD, which suggests disruptions of the regulatory network in the disease state. Notably, we find that the profiles of isomiRs and tRFs differ in patients belonging to different races. We hope that the presented findings can lay the groundwork for future research efforts aimed at elucidating the functional roles of the numerous and distinct members of these two categories of ncRNAs that are present in PRAD.


Conflict of interest statement

The authors declare no competing interests.

Figures

Figure 1
Figure 1
Classification of isomiRs by mature miRNA, length and endpoint. We collected 3,178 isomiRs from the pool of 526 TCGA PRAD samples. (A) The number of mature miRNAs which give rise to N isomiRs (N ranges from 1 to 40). (B) The number of isomiRs of each specific possible length from 16–30 nt within these data. (C) The number of isomiRs having different 5′ and 3′ endpoints with respect to the archetype miRNA’s endpoints. Note that this panel is restricted and shows only endpoints that differ by at most 3 nt from the endpoints of the archetype. (D) The top-11 miRNA loci producing 25 or more isomiRs.
Figure 2
Figure 2
Classification of tRFs by isodecoder and genome of origin. (A) Percentage of tRFs that map to a specific structural category (nuclearly- and MT-derived tRFs are shown separately). (B) Percentage of tRFs that arise from isodecoders of specific amino acids. (C) Distribution of tRFs as a function of length (nuclearly- and MT-derived tRFs are shown separately). The whiskers represent standard error of the mean  across samples. Nuc: nuclear. MT: mitochondrial.
Figure 3
Figure 3
Classification of tRFs by length and structural category, in normal and tumor. (A–C) Nuclear tRFs. (A) Distribution of 5′-tRFs arising from nuclear tRNAs. 5′-tRFs begin at either the −1 or the +1 position of the mature tRNA. (B) Distribution of i-tRFs from nuclear tRNAs. i-tRFs begin after the +1 position and terminate within the mature tRNA sequence. (C) 3′-tRFs from nuclear tRNAs. These tRFs begin within the mature tRNA and end within the post-transcriptionally-added CCA. (D–F) The counterpart distributions for 5′-tRFs, i-tRFs, and 3′-tRFs arising from mitochondrial tRNAs. In all plots, the distributions of tRFs in normal (tumor, respectively) samples are shown in green (red, respectively).
Figure 4
Figure 4
Differentially abundant isomiRs and tRFs in prostate cancer. We used SAM to determine which tRFs and isomiRs are differentially abundant at an FDR ≤ 5% in four comparisons: PRAD Wh vs. Normal Wh, PRAD B/Aa vs. Normal B/Aa, and PRAD Wh vs. PRAD B/Aa. (A) isomiRs. (B) tRFs. Representative molecules from the corresponding group of regulators are also listed. We found no isomiRs or tRFs that are differentially abundant between Normal Wh and Normal B/Aa, so these groups are not plotted.
Figure 5
Figure 5
Comparison of total RPM at miRNA arms and mature tRNA loci. Separately for each sample, we summed the RPM values of each isomiR that arises from a specific locus and assigned the resulting value to that locus. There were 628 loci that produced isomiRs in various combinations in the 526 samples. At most 20 of the miRNA-arms exhibiting differential abundances are shown in each case, if available. (A) PRAD vs. normal (all patients). (B) PRAD vs. normal (Wh patients only). (C) PRAD vs. normal (B/Aa patients only). (D) PRAD from Wh patients vs. PRAD from B/Aa patients. (E–H) counterpart plots to (A–D) for isoacceptors. Analogously, we summed the RPM values of each tRF that arises from a given isoacceptor, and assigned the resulting value to the isoacceptor. There were 47 isoacceptors that produce tRFs in various combinations in the 526 samples. At most 20 of the isoacceptors exhibiting differential abundances are shown in each case, if available.
Figure 6
Figure 6
Networks of isomiR-isomiR and tRF-tRF correlations. We collapsed isomiR (tRF, respectively) abundance to the corresponding miRNA-arm (tRNA isoacceptor, respectively), and computed Spearman correlations among the resulting observations. (A) isomiR-isomiR correlations represented by the corresponding miRNA arms. Gold nodes represent miRNAs. (B) tRF-tRF networks as captured by the corresponding isoacceptors. In both panels, only correlations with an absolute value ≥ 0.75 and an FDR ≤ 5% were retained and shown. Green edges: positive correlations. Red edges: negative correlations.
Figure 7
Figure 7
Correlation networks for isomiR-mRNA and tRF-mRNA relationships. We sub-selected differentially abundant isomiRs and tRFs and kept only those with mean abundance ≥1 RPM across all 526 datasets. We computed Spearman correlations isomiRs and tRFs and those mRNAs whose mean RPKM was ≥ 1/1024 of the largest abundance observed for ACTB as measured by sequenced reads. (A) isomiR-mRNA correlations. (B) tRF-mRNA correlations. In panels A and B, ncRNA nodes were collapsed to the name of the contributing miRNA locus (orange) or tRNA isodecoder (grey), respectively. Blue nodes represent mRNAs. In both panels, only correlations with an absolute value ≥ 0.33 and an FDR ≤ 5% were retained and shown. Green edges: positive correlations. Red edges: negative correlations.

References

    1. Londin E, et al. Analysis of 13 Cell Types Reveals Evidence for the Expression of Numerous Novel Primate- and Tissue-Specific microRNAs. Proceedings of the National Academy of the Sciences. 2014;112:E1106–E1115. doi: 10.1073/pnas.1420955112. - DOI - PMC - PubMed
    1. Friedlander MR, et al. Discovering microRNAs from Deep Sequencing Data Using miRDeep. Nature Biotechnology. 2008;26:407–415. doi: 10.1038/nbt1394. - DOI - PubMed
    1. Bartel DP. MicroRNAs: Genomics, Biogenesis, Mechanism, and Function. Cell. 2004;116:281–297. doi: 10.1016/S0092-8674(04)00045-5. - DOI - PubMed
    1. Iorio, M. V. & Croce, C. M. MicroRNA dysregulation in cancer: diagnostics, monitoring and therapeutics. A comprehensive review. EMBO Mol Med4, 10.1002/emmm.201100209 (2012). - PMC - PubMed
    1. Kayani, M., Kayani, M. A., Malik, F. A. & Faryal, R. Role of miRNAs in breast cancer. Asian Pac J Cancer Prev12 (2011). - PubMed

Publication types