. 2018 Mar 12:9:178.
doi: 10.3389/fphys.2018.00178. eCollection 2018.

KV4.3 Expression Modulates NaV1.5 Sodium Current

Affiliations

KV4.3 Expression Modulates NaV1.5 Sodium Current

Vincent Portero et al. Front Physiol. .

Abstract

In cardiomyocytes, the voltage-gated transient outward potassium current (Ito) is responsible for the phase-1 repolarization of the action potential (AP). Gain-of-function mutations in KCND3, the gene encoding the Ito carrying KV4.3 channel, have been associated with Brugada syndrome (BrS). While the role of Ito in the pro-arrhythmic mechanism of BrS has been debated, recent studies have suggested that an increased Ito may directly affect cardiac conduction. However, the effects of an increased Ito on AP upstroke velocity or sodium current at the cellular level remain unknown. We here investigated the consequences of KV4.3 overexpression on NaV1.5 current and consequent sodium channel availability. We found that overexpression of KV4.3 protein in HEK293 cells stably expressing NaV1.5 (HEK293-NaV1.5 cells) significantly reduced NaV1.5 current density without affecting its kinetic properties. In addition, KV4.3 overexpression decreased AP upstroke velocity in HEK293-NaV1.5 cells, as measured with the alternating voltage/current clamp technique. These effects of KV4.3 could not be explained by alterations in total NaV1.5 protein expression. Using computer simulations employing a multicellular in silico model, we furthermore demonstrate that the experimentally observed increase in KV4.3 current and concurrent decrease in NaV1.5 current may result in a loss of conduction, underlining the potential functional relevance of our findings. This study gives the first proof of concept that KV4.3 directly impacts on NaV1.5 current. Future studies employing appropriate disease models should explore the potential electrophysiological implications in (patho)physiological conditions, including BrS associated with KCND3 gain-of-function mutations.

Keywords: action potential; arrhythmias; channels; computer simulation; myocyte; sodium current; transient outward current.


Figures

Figure 1
Figure 1
KV4.3 currents in HEK293-NaV1.5 cells transfected with KCND3. (A) Typical current traces in response to voltage clamp steps to test potentials ranging from −100 to 40 mV recorded from HEK293 cells stably expressing NaV1.5 (HEK293-NaV1.5) and transfected with IRES-GFP (top) or KCND3-IRES-GFP (bottom). Inset: voltage clamp protocol used. (B) Current-voltage (I-V) relationships of the peak outward current in KCND3-IRES-GFP and IRES-GFP transfected cells. Asterisks denote p < 0.05. (C) Voltage-dependency of KV4.3 inactivation in KV4.3-IRES-GFP cells (n = 8). The dotted line is the Boltzmann fit to the average data. Inset: voltage clamp protocol used. (D) Average recovery from inactivation curve measured with two subsequent 200-ms pulses from −80 to +40 mV with variable inter-pulse durations (Δt) of 1–1,000-ms (n = 4). Inset: voltage clamp protocol used. The red dashed line is a mono-exponential fit of the average data.
Figure 2
Figure 2
KV4.3 overexpression reduces NaV1.5 currents. (A) Typical NaV1.5 current traces in response to 500-ms depolarizing voltage steps from a holding potential of −120 mV to test potentials ranging from −160 to 50 mV in IRES-GFP (top) and KCND3-IRES-GFP (bottom) transfected HEK293-NaV1.5 cells. Inset: voltage clamp protocol used. (B) Average I-V relationships of the NaV1.5 peak current in IRES-GFP and KCND3-IRES-GFP transfected cells. Asterisks denote p < 0.05. (C,D) Average steady-state inactivation (C) and activation (D) curves. Insets: voltage clamp protocol used. Voltage-dependency of inactivation was measured using a two-pulse protocol where a 500-ms conditioning prepulse to membrane potentials between −160 and 50 mV (to induce steady-state inactivation), was followed by a 50-ms test pulse to −20 mV. Voltage-dependency of activation was measured using the same protocol described as described in (A).
Figure 3
Figure 3
NaV1.5 total expression is not affected by KV4.3 overexpression. (A) Representative Western blots of NaV1.5, calnexin and GFP protein expression in HEK293-NaV1.5 cells. Data from IRES-GFP and KCND3-IRES-GFP transfected cells as well as untransfected cells. Total lysate of HEK293 cells lacking the NaV1.5 overexpression cassette (leftmost lane) was used as negative control for NaV1.5 antibody specificity. (B) Average total NaV1.5 expression normalized to calnexin protein expression in KCND3-IRES-GFP transfected HEK293-NaV1.5 cells, compared to IRES-GFP transfected HEK293-NaV1.5 cells (n = 6, 3 different blots).
Figure 4
Figure 4
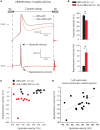
KV4.3 overexpression reduces upstroke velocities. (A) Typical examples of upstrokes in KCND3-IRES-GFP and IRES-GFP transfected HEK293-NaV1.5 cells measured with the alternating voltage/current clamp (VC/CC) technique (top) and time derivatives of these upstrokes (bottom). Arrows indicate the maximum AP upstroke and repolarization velocities. (B) Average AP upstroke (top) and repolarization velocities (bottom). Asterisks denote p < 0.05. (C) Relationship of upstroke and repolarization velocities in HEK293-NaV1.5 cells. (D) Relationship of AP upstroke and repolarization velocities in murine isolated left ventricular myocytes. The solid line represents the linear fit (Pearson's coefficient: r = 0.53).
Figure 5
Figure 5
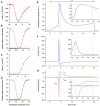
Numerical reconstruction of NaV1.5 and KV4.3 currents in alternating VC/CC experiments. (A–D) Characteristics of the simulated hNaV1.5 driven fast sodium current (INa) and hKV4.3 driven transient outward current (Ito). (A) INa peak current as obtained with the voltage clamp protocol of Figure 2. (B) INa steady-state activation and inactivation curves (closed and open symbols, respectively) as obtained with the voltage clamp protocol of Figure 2. (C) Ito peak current as obtained with the voltage clamp protocol of Figure 1. (D) Ito steady-state activation and inactivation curves (closed and open symbols, respectively). (E–G) Reconstruction of the alternating VC/CC experiment. (E) Membrane potential (Vm) during the 20-ms current clamp (CC) phase. Inset: Vm on an expanded time scale. (F) Time derivative of the membrane potential trace of (E). Inset: dVm/dt on an expanded time scale. (G) Individual time courses of INa, Ito, and the 20-ms inward stimulus current (Istim). Note the axis break. Inset: INa, Ito, and Istim on an expanded time scale. The vertical dashed lines in (E–G) indicate the time of the maximum upstroke velocity (left lines) and the time of the maximum repolarization velocity (right lines). Alternating VC/CC protocol as in the patch-clamp experiments on HEK293-NaV1.5 cells.
Figure 6
Figure 6
Effect of INa and Ito density on maximum upstroke and repolarization velocity in simulated murine left ventricular myocytes. (A–C) Characteristics of the computer model of apical mouse ventricular myocytes (Bondarenko et al., 2004) used in the simulations. (A) Action potential (top) and associated INa and Ito (bottom). (B) INa peak current (top) and steady-state activation and inactivation curves (bottom; closed and open symbols, respectively), as obtained with the voltage clamp protocol of Figure 2. (C) Ito peak current (top) and steady-state activation and inactivation curves (bottom; closed and open symbols, respectively), as obtained with the voltage clamp protocol of Figure 1. (D,E) Maximum upstroke velocity and maximum repolarization velocity as obtained in a reconstruction of the alternating VC/CC experiment. (D) Maximum upstroke velocity (filled symbols) and maximum repolarization velocity (open symbols) as a function of Ito conductance (Gto) at a constant value of INa conductance (GNa). (E) Maximum upstroke velocity and maximum repolarization velocity as a function of GNa at a constant value of Gto. Alternating VC/CC protocol as in the patch-clamp experiments on murine left ventricular myocytes.
Figure 7
Figure 7
Effect of INa and Ito density on action potential propagation in a simulated strand of human left ventricular myocytes. (A) Geometry of the strand. The intercellular coupling conductance (gj) was set to 6 nS and the myoplasmic resistivity was set to 150 Ω·cm. (B–E) Action potential propagation in the strand as a function of INa conductance (GNa) and Ito conductance (Gto). (B) Control conditions: GNa and Gto both set to 100% of their control value. (C) Slight slowing of action potential propagation upon an increase in Gto to 120% of its control value. (D) Slowing of action potential propagation upon a decrease in GNa to 50% of its control value. (E) Failure of action potential propagation upon a concomitant decrease in GNa and increase in Gto.

Similar articles

Cited by

References

    1. Agullo-Pascual E., Lin X., Leo-Macias A., Zhang M., Liang F.-X., Li Z., et al. (2014). Super-resolution imaging reveals that loss of the C-terminus of connexin43 limits microtubule plus-end capture and NaV1.5 localization at the intercalated disc. Cardiovasc. Res. 104, 371–381. 10.1093/cvr/cvu195 - DOI - PMC - PubMed
    1. Balse E., Boycott H. E. (2017). Ion channel trafficking: control of ion channel density as a target for arrhythmias? Front. Physiol. 8:808. 10.3389/fphys.2017.00808 - DOI - PMC - PubMed
    1. Barry P. H., Lynch J. W. (1991). Liquid junction potentials and small cell effects in patch-clamp analysis. J. Membr. Biol. 121, 101–117. 10.1007/BF01870526 - DOI - PubMed
    1. Benson D. W., Wang D. W., Dyment M., Knilans T. K., Fish F. A., Strieper M. J., et al. (2003). Congenital sick sinus syndrome caused by recessive mutations in the cardiac sodium channel gene (SCN5A). J. Clin. Invest. 112, 1019–1028. 10.1172/JCI18062 - DOI - PMC - PubMed
    1. Berecki G., Wilders R., de Jonge B., van Ginneken A. C. G., Verkerk A. O. (2010). Re-evaluation of the action potential upstroke velocity as a measure of the Na+ current in cardiac myocytes at physiological conditions. PLoS ONE 5:e15772. 10.1371/journal.pone.0015772 - DOI - PMC - PubMed

LinkOut - more resources