An Individualized, Perception-Based Protocol to Investigate Human Physiological Responses to Cooling
- PMID: 29593558
- PMCID: PMC5859361
- DOI: 10.3389/fphys.2018.00195
An Individualized, Perception-Based Protocol to Investigate Human Physiological Responses to Cooling
Abstract
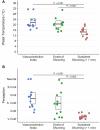
Cold exposure, a known stimulant of the thermogenic effects of brown adipose tissue (BAT), is the most widely used method to study BAT physiology in adult humans. Recently, individualized cooling has been recommended to standardize the physiological cold stress applied across participants, but critical experimental details remain unclear. The purpose of this work was to develop a detailed methodology for an individualized, perception-based protocol to investigate human physiological responses to cooling. Participants were wrapped in two water-circulating blankets and fitted with skin temperature probes to estimate BAT activity and peripheral vasoconstriction. We created a thermoesthesia graphical user interface (tGUI) to continuously record the subject's perception of cooling and shivering status during the cooling protocol. The protocol began with a 15 min thermoneutral phase followed by a series of 10 min cooling phases and concluded when sustained shivering (>1 min duration) occurred. Researchers used perception of cooling feedback (tGUI ratings) to manually adjust and personalize the water temperature at each cooling phase. Blanket water temperatures were recorded continuously during the protocol. Twelve volunteers (ages: 26.2 ± 1.4 years; 25% female) completed a feasibility study to evaluate the proposed protocol. Water temperature, perception of cooling, and shivering varied considerably across participants in response to cooling. Mean clavicle skin temperature, a surrogate measure of BAT activity, decreased (-0.99°C, 95% CI: -1.7 to -0.25°C, P = 0.16) after the cooling protocol, but an increase in supraclavicular skin temperature was observed in 4 participants. A strong positive correlation was also found between thermoesthesia and peripheral vasoconstriction (ρ = 0.84, P < 0.001). The proposed individualized, perception-based protocol therefore has potential to investigate the physiological responses to cold stress applied across populations with varying age, sex, body composition, and cold sensitivity characteristics.
Keywords: brown adipose tissue; cold exposure; humans; shivering; supraclavicular skin temperature; thermoregulation; vasoconstriction.
Figures


Similar articles
-
A New Personalized Cooling Protocol to Activate Brown Adipose Tissue in Young Adults.Front Physiol. 2017 Nov 2;8:863. doi: 10.3389/fphys.2017.00863. eCollection 2017. Front Physiol. 2017. PMID: 29163207 Free PMC article.
-
Brown Adipose Tissue Is Linked to a Distinct Thermoregulatory Response to Mild Cold in People.Front Physiol. 2016 Apr 19;7:129. doi: 10.3389/fphys.2016.00129. eCollection 2016. Front Physiol. 2016. PMID: 27148068 Free PMC article.
-
Concurrent validity of supraclavicular skin temperature measured with iButtons and infrared thermography as a surrogate marker of brown adipose tissue.J Therm Biol. 2019 May;82:186-196. doi: 10.1016/j.jtherbio.2019.04.009. Epub 2019 Apr 20. J Therm Biol. 2019. PMID: 31128647
-
Hot heads & cool bodies: The conundrums of human brown adipose tissue (BAT) activity research.Eur J Intern Med. 2017 May;40:26-29. doi: 10.1016/j.ejim.2016.12.023. Epub 2017 Jan 5. Eur J Intern Med. 2017. PMID: 28065662 Review.
-
Human physiological responses to cold exposure.Aviat Space Environ Med. 2004 May;75(5):444-57. Aviat Space Environ Med. 2004. PMID: 15152898 Review.
Cited by
-
Altered brown fat thermoregulation and enhanced cold-induced thermogenesis in young, healthy, winter-swimming men.Cell Rep Med. 2021 Oct 11;2(10):100408. doi: 10.1016/j.xcrm.2021.100408. eCollection 2021 Oct 19. Cell Rep Med. 2021. PMID: 34755128 Free PMC article.
-
Cold exposure induces dynamic, heterogeneous alterations in human brown adipose tissue lipid content.Sci Rep. 2019 Sep 19;9(1):13600. doi: 10.1038/s41598-019-49936-x. Sci Rep. 2019. PMID: 31537877 Free PMC article.
References
-
- American Society of Heating Refrigerating and Air-Conditioning Engineers (2005). Ashrae Handbook Fundamentals I-P Edition. Atlanta, GA: ASHRAE Research.
-
- Bakker L. E., Boon M. R., van der Linden R. A., Arias-Bouda L. P., van Klinken J. B., Smit F., et al. . (2014). Brown adipose tissue volume in healthy lean south Asian adults compared with white Caucasians: a prospective, case-controlled observational study. Lancet Diab. Endocrinol. 2, 210–217. 10.1016/S2213-8587(13)70156-6 - DOI - PubMed
-
- Bell D. G., Tikuisis P., Jacobs I. (1992). Relative intensity of muscular contraction during shivering. J. Appl. Physiol. 72, 2336–2342. - PubMed
Grants and funding
LinkOut - more resources
Full Text Sources
Other Literature Sources
Molecular Biology Databases

