. 2018 Mar 9:9:196.
doi: 10.3389/fphys.2018.00196. eCollection 2018.

Ghrelin Pre-treatment Attenuates Local Oxidative Stress and End Organ Damage During Cardiopulmonary Bypass in Anesthetized Rats

Affiliations

Ghrelin Pre-treatment Attenuates Local Oxidative Stress and End Organ Damage During Cardiopulmonary Bypass in Anesthetized Rats

Vijayakumar Sukumaran et al. Front Physiol. .

Abstract

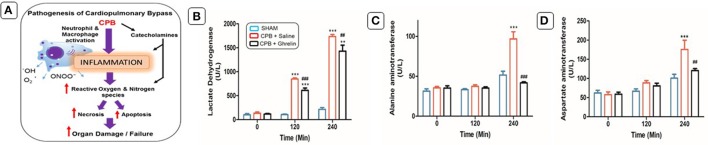
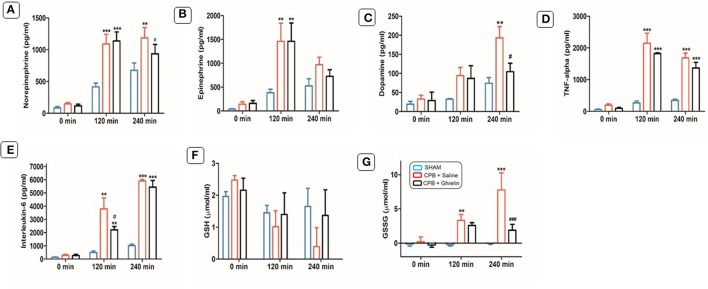
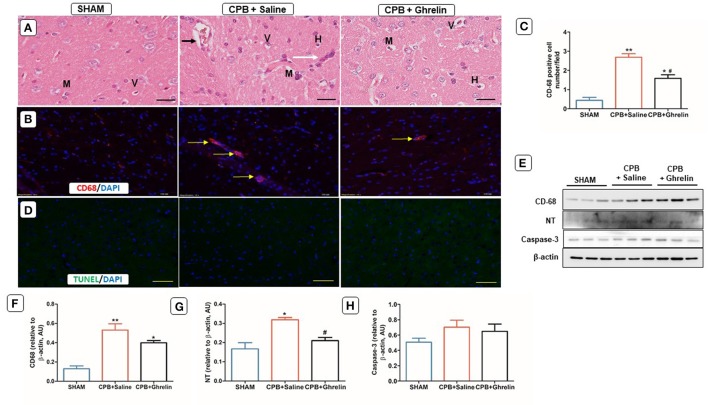
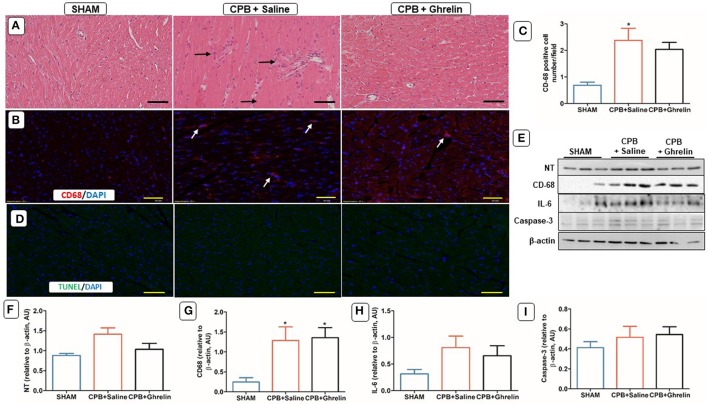
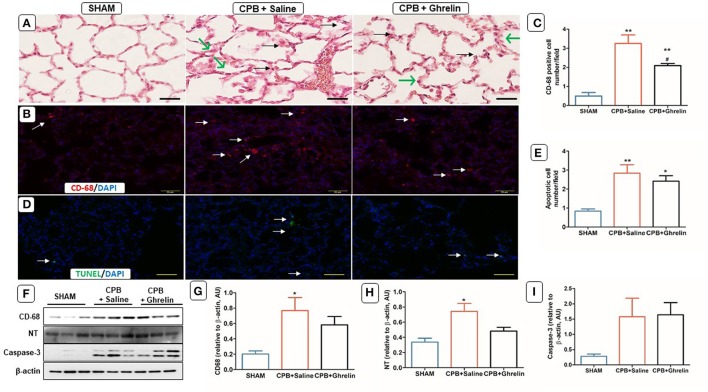
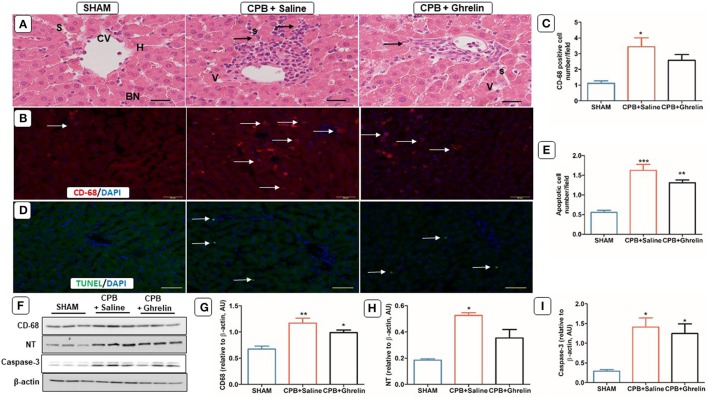
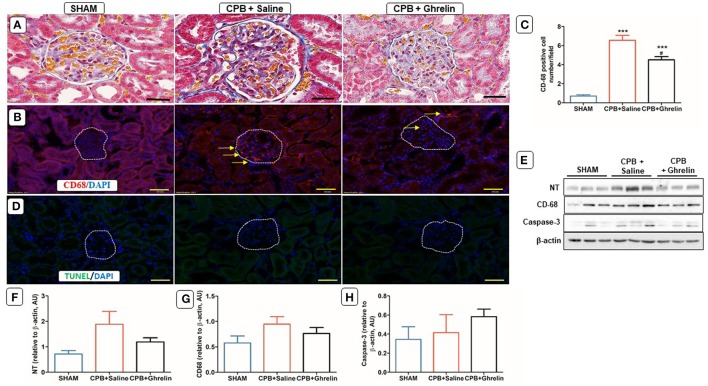
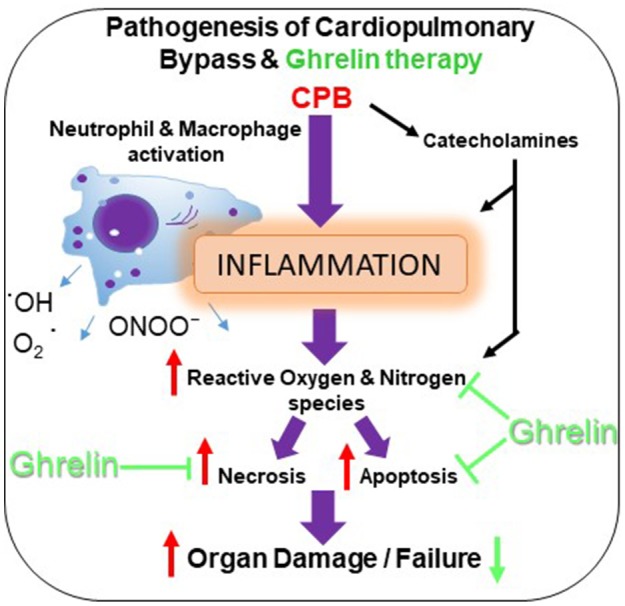
Cardiopulmonary bypass (CPB) induced systemic inflammation significantly contributes to the development of postoperative complications, including respiratory failure, myocardial, renal and neurological dysfunction and ultimately can lead to failure of multiple organs. Ghrelin is a small endogenous peptide with wide ranging physiological effects on metabolism and cardiovascular regulation. Herein, we investigated the protective effects of ghrelin against CPB-induced inflammatory reactions, oxidative stress and acute organ damage. Adult male Sprague Dawley rats randomly received vehicle (n = 5) or a bolus of ghrelin (150 μg/kg, sc, n = 5) and were subjected to CPB for 4 h (protocol 1). In separate rats, ghrelin pre-treatment (protocol 2) was compared to two doses of ghrelin (protocol 3) before and after CPB for 2 h followed by recovery for 2 h. Blood samples were taken prior to CPB, and following CPB at 2 h and 4 h. Organ nitrosative stress (3-nitrotyrosine) was measured by Western blotting. CPB induced leukocytosis with increased plasma levels of tumor necrosis factor-α and interleukin-6 indicating a potent inflammatory response. Ghrelin treatment significantly reduced plasma organ damage markers (lactate dehydrogenase, aspartate aminotransferase, alanine aminotransferase) and protein levels of 3-nitrotyrosine, particularly in the brain, lung and liver, but only partly suppressed inflammatory cell invasion and did not reduce proinflammatory cytokine production. Ghrelin partially attenuated the CPB-induced elevation of epinephrine and to a lesser extent norepinephrine when compared to the CPB saline group, while dopamine levels were completely suppressed. Ghrelin treatment sustained plasma levels of reduced glutathione and decreased glutathione disulphide when compared to CPB saline rats. These results suggest that even though ghrelin only partially inhibited the large CPB induced increase in catecholamines and organ macrophage infiltration, it reduced oxidative stress and subsequent cell damage. Pre-treatment with ghrelin might provide an effective adjunct therapy for preventing widespread CPB induced organ injury.

Keywords: cardiopulmonary bypass; ghrelin; inflammation; organ damage; oxidative stress.


Figures

Figure 1
Figure 1
Schematic diagram showing the pathophysiological changes during the CPB (A). Ghrelin treatment improved organ damage indices. Effects of ghrelin on LDH (B), ALT (C), and AST (D) before, and after 120 min and 240 min of CPB. The data shown are the mean ± SEM; N = 5 rats per group. Statistical differences were determined by two-way ANOVA followed by Tukey's test or Student's unpaired t-test. **p < 0.01, ***p < 0.001 vs. sham group; ##p < 0.01, ###p < 0.001 vs. CPB saline group.
Figure 2
Figure 2
Ghrelin treatment partially improved plasma catecholamine, cytokine levels and the balance between reduced glutathione and oxidized glutathione in rats during CPB. Plasma levels of norepinephrine (A), epinephrine (B), dopamine (C), TNF- α (D), IL-6 (E), total GSH (F), and GSSG (G) before, and after 120 and 240 min of CPB. The data shown are the mean ± SEM; N = 5 rats per group. Statistical differences were determined by two-way ANOVA followed by Tukey's test or Student's unpaired t-test. **p < 0.01, ***p < 0.001 vs. sham group; #p < 0.05, ###p < 0.001 vs. CPB saline group.
Figure 3
Figure 3
Ghrelin treatment partially reduced infiltration by leukocytes during CPB in the rat brain cerebral cortex. (A) H&E stained brain section of a sham rat showing normal features of primary immune cells; a CPB saline treated group (vehicle) rat showing focal inflammatory cell infiltration (white arrow), deeply stained dark nuclei (hyperchromatic cells) (H), multinucleated cells (M), vascular congestion (small black arrow), and vacuolated cells (V); a ghrelin treated CPB rat showing fewer infiltrating cells. (B) Immunofluorescence staining showed greater macrophage infiltration in the CPB saline group than in the ghrelin group. CD-68 positively-stained in microglial cells (evident in all groups) along with macrophages (yellow arrows) are shown by the red stain. (C) Quantitative measurement of CD-68 positive cell number/field across 20 fields. (D) In situ TUNEL-assay was used to assess the number of apoptotic cells (green stain)/field across 20 fields in the cerebral cortex. Nuclei were labeled with 4′, 6-diamidino-2-phenylindole (DAPI, blue). The merged image is presented in these panels. In all microscopy images the scale bar is 50 μm. (E) Protein expression levels of CD-68 (68 kDa), NT (72 kDa) and caspase-3 detected by Western blotting. β-actin (38 kDa) was used as an internal control. (F-H) Bar graph showing the densitometric analysis of the CD-68, NT and caspase-3 Western blots. The data shown are the mean ± SEM; N = 3 rats per group. Data were analyzed by a one-way ANOVA followed by Tukey's post hoc test. *p < 0.05, **p < 0.01 vs. sham group; #p < 0.05 vs. CPB saline group.
Figure 4
Figure 4
Ghrelin treatment did not reduce immune cell infiltration and oxidative stress due to CPB in the rat heart, but not IL-6 protein expression. (A) H&E stained heart section of a sham rat showing normal features of cardiomyocytes, blood vessels and endomysium; a CPB saline group rat showing focal accumulations of infiltrating immune cells (black arrows) and degenerating myocardial cells; a ghrelin treated rat showing reduced focal accumulations and a marginal number of degenerating myocardial cells. (B) Immunofluorescence staining was used to access the levels of CD-68 macrophages (red stain, white arrows) positively-stained in cardiomyocytes. (C) Quantitative measurement of CD-68 positive cell number/field across 20 fields. (D) In situ TUNEL-assay was used to access the apoptotic cell number (green stain)/field across 20 fields in the myocardium. Nuclei were labeled with 4′, 6-diamidino-2-phenylindole (DAPI, blue). The merged image is presented in this figure. In all images scale bar is 50 μm. (E) Myocardial protein expression levels of NT, CD-68, IL-6, and caspase-3 was detected by Western blotting. β-actin was used as an internal control. (F–I) Bar graphs showing the densitometric analysis of the NT, CD-68, and IL-6 Western blots. The data shown are the mean ± SEM; N = 3 rats per group. Data were analyzed by a one-way ANOVA followed by Tukey's post hoc test. *p < 0.05 vs. sham group.
Figure 5
Figure 5
Ghrelin treatment improved inflammation, oxidative stress but not apoptosis in rat lungs following CPB. (A) H&E stained lung section of a sham rat showing normal features of alveolar capillary membrane; a CPB saline group rat showing inflammatory cell infiltration (black arrows) and thickening of alveolar capillary membrane (green arrows); a ghrelin treated rat showing reduced inflammatory cell infiltration (black arrows) but thickening of the alveolar capillary membrane (green arrows). (B) Immunofluorescence staining was used to access the levels of CD-68 macrophages (red stain; white arrow) positively-stained in alveolar capillary membrane. (C) Quantitative measurement of CD-68 positive cell per 20 fields. (D) In situ TUNEL-assay was used to access the apoptotic cells per 20 fields (green stain; white arrow) in the lungs. Nuclei were labeled with 4', 6-diamidino-2-phenylindole (DAPI, blue). The merged image is presented in this figure. In all images scale bar is 50 μm. (E) Quantitative measurement of apoptotic cell number/field across 20 fields. (F) Protein expression levels of CD-68, NT and caspase-3 detected by Western blotting. β-actin was used as an internal control. (G–I) Bar graph showing the densitometric analysis of the CD-68, NT and caspase-3 Western blots. The data shown are the mean ± SEM; N = 3 rats per group. Data were analyzed by a one-way ANOVA followed by Tukey's post hoc test. *p < 0.05, **p < 0.01 vs. sham group; #p < 0.05 vs. CPB saline group.
Figure 6
Figure 6
Ghrelin treatment improved liver inflammation, oxidative stress but not apoptosis in rats following CPB. (A) H&E stained liver section of a sham rat showing normal features of central vein (CV), hepatocytes (H), sinusoids (S) and bi-nucleated cells (BN); a CPB rat showing increased mononuclear cell infiltration (black arrows) and vacuolated cells (V); a ghrelin treated rat showing fewer V and infiltrating cells (black arrows). (B) Immunofluorescence staining was used to access the levels of CD-68 macrophage (red stain; white arrows) positively-staining in the liver. In all images the scale bar is 50 μm. (C) Quantitative measurement of CD-68 positive cell number/field across 20 fields. (D) In situ TUNEL-assay was used to assess the apoptotic cell number (green stain; white arrow)/field across 20 fields in liver. Nuclei were labeled with 4′, 6-diamidino-2-phenylindole (DAPI, blue). The merged image is presented in this figure. In all images scale bar is 50 μm. (E) Quantitative measurement of apoptotic cell number/field across 20 fields. (F) Protein expression levels of CD-68, NT and caspase-3 detected by Western blotting. β-actin was used as an internal control. (G–I) Bar graph showing the densitometric analysis of the CD-68 and NT caspase-3 Western blots. The data shown are the mean ± SEM; N = 3 rats per group. Data were analyzed by a one-way ANOVA followed by Tukey's post hoc test. *p < 0.05, **p < 0.01, ***p < 0.001 vs. sham group.
Figure 7
Figure 7
Ghrelin treatment improved renal inflammation, but not apoptosis in rats following CPB. (A) Azan-Mallory stained kidney section of a sham rat showing a normal glomerular membrane, capsular and tubular capillaries; a CPB rat showing the presence of collagen accumulations (blue staining) surrounding the tubules, inflammatory cell infiltration within the glomerulus and increased capsular space; a ghrelin treated rat showing reduced cell infiltration and capsular space (40x). (B) Immunofluorescence staining was used to access the levels of renal cortical CD-68 (red stain; yellow arrows) positively-stained cells. (C) Quantitative measurement of CD-68 positive cell per 20 fields. (D) In situ TUNEL-assay showed the absence of apoptotic cells (green stain) in the glomeruli. Nuclei were labeled with 4', 6-diamidino-2-phenylindole (DAPI, blue). The merged image is presented in this figure. In all images scale bar is 50 μm. (E) Protein expression levels of NT, CD-68 and caspase-3 detected by Western blotting. β-actin was used as an internal control. (F–H) Bar graph showing the densitometric analysis of the NT, CD-68 and caspase-3 Western blots. The data shown are the mean ± SEM; N = 3 rats per group. Data were analyzed by a one-way ANOVA followed by Tukey's post hoc test. ***p < 0.001 vs. sham group; #p < 0.05 vs. CPB saline group.
Figure 8
Figure 8
Schematic representation showing the beneficial effects of ghrelin treatment on CPB-induced organ injury.

Similar articles

Cited by

References

    1. Abdel-Salam O. M. E., Nada S. A., Salem N. A., El-Sayed El-Shamarka M., Omara E. (2013). Effect of Cannabis sativa on oxidative stress and organ damage after systemic endotoxin administration in mice. Comp. Clin. Pathol. 23, 1069–1085. 10.1007/s00580-013-1745-1 - DOI
    1. Ahsan H. (2013). 3-Nitrotyrosine: a biomarker of nitrogen free radical species modified proteins in systemic autoimmunogenic conditions. Hum. Immunol. 74, 1392–1399. 10.1016/j.humimm.2013.06.009 - DOI - PubMed
    1. Alston R. P., Anderson A., Sanger K. (2006). Is body surface area still the best way to determine pump flow rate during cardiopulmonary bypass? Perfusion 21, 139–147. 10.1191/0267659106pf865oa - DOI - PubMed
    1. Boyle E. M., Pohlman T. H., Johnson M. C., Verrier E. D. (1997). Endothelial cell injury in cardiovascular surgery: the systemic inflammatory response. Ann. Thorac. Surg. 63, 277–284. - PubMed
    1. Callaghan B., Hunne B., Hirayama H., Sartor D. M., Nguyen T. V., Abogadie F. C., et al. . (2012). Sites of action of ghrelin receptor ligands in cardiovascular control. Am. J. Physiol. Heart Circ. Physiol. 303, H1011–H1021. 10.1152/ajpheart.00418.2012 - DOI - PubMed

LinkOut - more resources