. 2018 Mar 14:9:215.
doi: 10.3389/fphys.2018.00215. eCollection 2018.

Mechanistic Role of Reactive Oxygen Species and Therapeutic Potential of Antioxidants in Denervation- or Fasting-Induced Skeletal Muscle Atrophy

Affiliations

Mechanistic Role of Reactive Oxygen Species and Therapeutic Potential of Antioxidants in Denervation- or Fasting-Induced Skeletal Muscle Atrophy

Jiaying Qiu et al. Front Physiol. .

Abstract

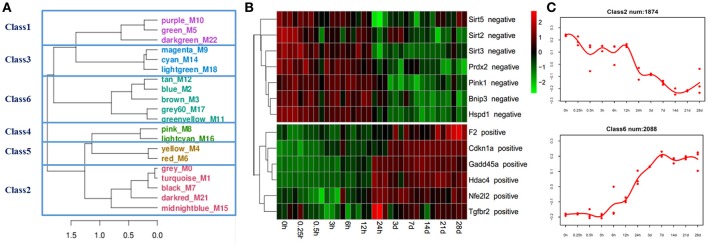
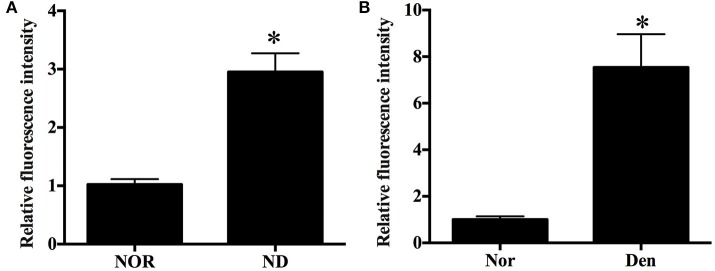
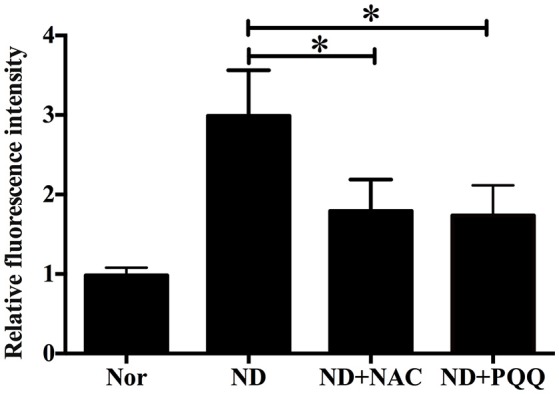
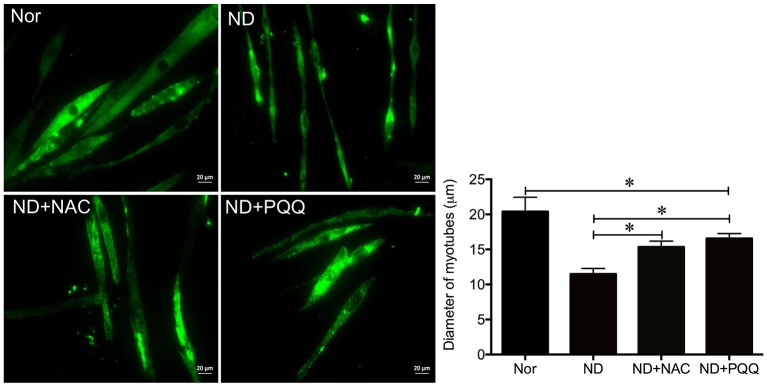
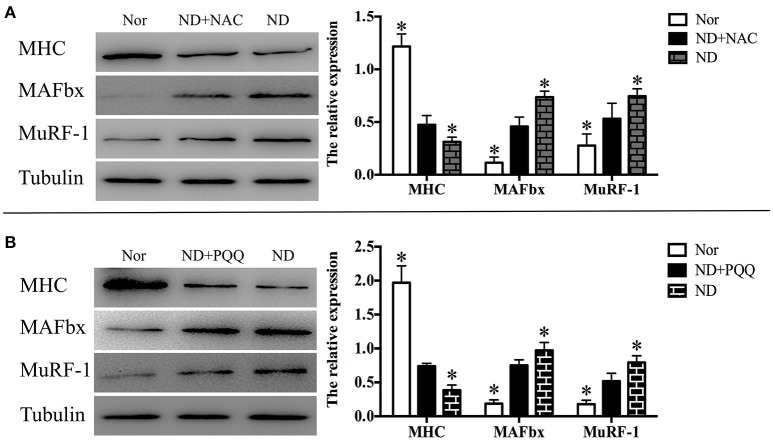
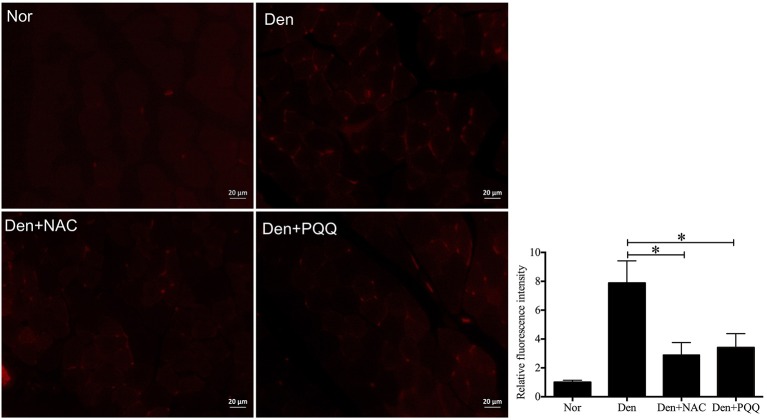
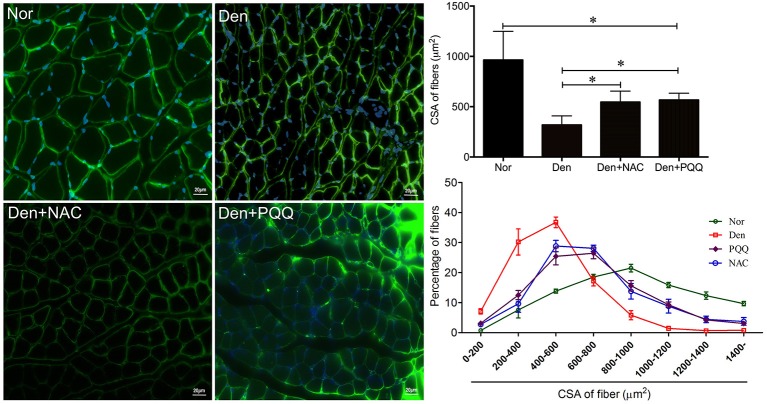
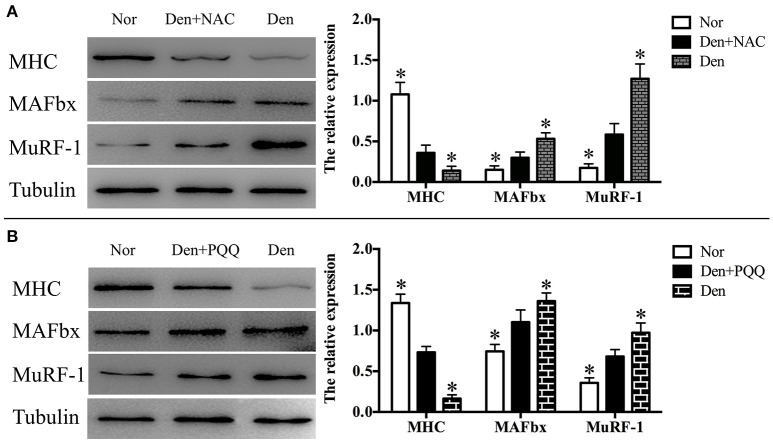
Skeletal muscle atrophy occurs under various conditions, such as disuse, denervation, fasting, aging, and various diseases. Although the underlying molecular mechanisms are still not fully understood, skeletal muscle atrophy is closely associated with reactive oxygen species (ROS) overproduction. In this study, we aimed to investigate the involvement of ROS in skeletal muscle atrophy from the perspective of gene regulation, and further examine therapeutic effects of antioxidants on skeletal muscle atrophy. Microarray data showed that the gene expression of many positive regulators for ROS production were up-regulated and the gene expression of many negative regulators for ROS production were down-regulated in mouse soleus muscle atrophied by denervation (sciatic nerve injury). The ROS level was significantly increased in denervated mouse soleus muscle or fasted C2C12 myotubes that had suffered from fasting (nutrient deprivation). These two muscle samples were then treated with N-acetyl-L-cysteine (NAC, a clinically used antioxidant) or pyrroloquinoline quinone (PQQ, a naturally occurring antioxidant), respectively. As compared to non-treatment, both NAC and PQQ treatment (1) reversed the increase in the ROS level in two muscle samples; (2) attenuated the reduction in the cross-sectional area (CSA) of denervated mouse muscle or in the diameter of fasted C2C12 myotube; (3) increased the myosin heavy chain (MHC) level and decreased the muscle atrophy F-box (MAFbx) and muscle-specific RING finger-1 (MuRF-1) levels in two muscle samples. Collectively, these results suggested that an increased ROS level was, at least partly, responsible for denervation- or fasting-induced skeletal muscle atrophy, and antioxidants might resist the atrophic effect via ROS-related mechanisms.

Keywords: N-acetyl-L-cysteine; antioxidant therapy; microarray; pyrroloquinoline quinone; reactive oxidative species; skeletal muscle atrophy.


Figures

Figure 1
Figure 1
Bioinformatics analysis of gene expression in skeletal muscles identifies distinct modules of co-expression genes. (A) The gene modules generated by weighted gene coexpression network analysis (WGCNA) using microarrays data from 36 skeletal muscle samples. The 20 co-expression modules were obtained and clustered into 6 classes by cluster merging module. (B) Heatmap of ROS production-related genes, positive regulators for ROS production were gradually up-regulated, and negative regulators for ROS production were gradually down-regulated. (C) The negative and positive regulators for ROS production were mainly distributed in classes 2 and 6, respectively.
Figure 2
Figure 2
Histograms showing an increased ROS level in (A) C2C12 myotubes suffering from fasting (nutrient deprivation, ND) or (B) mouse soleus muscles atrophied by denervation (Den) as compared to that in (A) C2C12 myotubes or (B) mouse soleus muscles without exposure to fasting or denervation stimulation (Nors, serving as respective controls) respectively. *p < 0.05 vs. Nor.
Figure 3
Figure 3
After fasted C2C12 myotubes were incubated with Hank's balanced salt solution for 12 h in the absence or presence of 5 mM NAC or 80 μM PQQ, DCF staining was performed to determine the ROS level in different samples, including normal myotubes (Nor, without exposure to atrophic stimulation and antioxidant treatment), fasted C2C12 myotubes (ND), fasted C2C12 myotubes treated with NAC (ND+NAC), and fasted C2C12 myotubes treated with PQQ (ND+PQQ). Histogram comparing the ROS level (as expressed by DCF fluorescence intensity) among different myotube samples. *p < 0.05.
Figure 4
Figure 4
After fasted C2C12 myotubes were incubated with Hank's balanced salt solution for 12 h in the absence or presence of 5 mM NAC or 80 μM PQQ, MHC staining was performed to quantify the diameter of different myotube samples, including normal C2C12 myotubes (Nor, without exposure to atrophic stimulation and antioxidant treatment), fasted C2C12 myotubes (ND), fasted C2C12 myotubes treated with NAC (ND+NAC), and fasted C2C12 myotubes treated with PQQ (ND+PQQ). Histogram (Right) comparing the myotube diameter among different myotube samples, where the myotube diameter value is expressed as the mean ± SD from three independent experiments. *p < 0.05. Also shown (Left) are representative MHC staining images.
Figure 5
Figure 5
After fasted C2C12 myotubes were incubated with Hank's balanced salt solution for 12 h in the absence or presence of 5 mM NAC (A) or 80 μM PQQ (B), Western blot analysis was performed to determine the protein levels of MHC, MuRF-1, and MAFbx in different myotube samples, including normal myotubes (Nor, without exposure to atrophic stimulation and antioxidant treatment), fasted C2C12 myotubes (ND), fasted C2C12 myotubes treated with NAC (ND+NAC), and fasted C2C12 myotubes treated with PQQ (ND+PQQ). Representative Histogram (right) comparing the MHC, MuRF-1, and MAFbx levels among different myotube samples, and *p < 0.05 vs. ND+NAC (A) or ND+PQQ (B), respectively. Also shown (left) are representative Western blot images.
Figure 6
Figure 6
After mice with denervation-induced soleus muscle atrophy had been injected with saline vehicle or saline vehicle plus NAC (100 mg/kg) or PQQ (5 mg/kg) for 14 days, the mouse soleus muscle was harvested for determining the ROS level using DHE staining. Different muscle samples were harvested from mice receiving sham-operation and further saline treatment (Nor, serving as control), mice receiving sciatic nerve transection and further saline treatment (Den), mice receiving sciatic nerve transection and further saline plus NAC treatment (Den+NAC), and mice receiving sciatic nerve transection and further saline plus PQQ treatment (Den+PQQ), respectively. Histogram (right) comparing the ROS level (as expressed by DHE fluorescence intensity) among different muscle samples (n = 6). *p < 0.05. Also shown (left) are representative DHE staining images.
Figure 7
Figure 7
After mice with denervation-induced soleus muscle atrophy had been injected with saline vehicle or saline vehicle plus NAC (100 mg/Kg) or PQQ (5 mg/kg) for 14 days, the mouse soleus muscle was harvested for determining the fiber CSA. Different muscle samples were harvested from mice receiving sham-operation and further saline treatment (Nor, serving as control), mice receiving sciatic nerve transection and further saline treatment (Den), mice receiving sciatic nerve transection and further saline plus NAC treatment (Den+NAC), and mice receiving sciatic nerve transection and further saline plus PQQ treatment (Den+PQQ), respectively. Histogram (Right) comparing the fiber CSA (upper: absolute value, and lower: distribution frequency) among different muscle samples, where the fiber CSA value is expressed as the mean ± SD from three independent experiments (n = 6). *p < 0.05. Also shown (Left) are representative laminin staining images.
Figure 8
Figure 8
After mice with denervation-induced soleus muscle atrophy had been injected with saline vehicle or saline vehicle plus NAC (100 mg/kg, A) or PQQ (5 mg/kg, B) for 14 days, the mouse soleus muscle was harvested to undergo Western blot analysis. Different muscle samples were harvested from mice receiving sham-operation and further saline treatment (Nor, serving as control), mice receiving sciatic nerve transection and further saline treatment (Den), mice receiving sciatic nerve transection and further saline plus NAC treatment (Den+NAC), and mice receiving sciatic nerve transection and further saline plus PQQ treatment (Den+PQQ), respectively. Histograms (right) comparing the MHC, MuRF-1, and MAFbx levels among different muscle samples (n = 6). *p < 0.05 vs. Den+NAC (A) or Den+PQQ (B), respectively. Also shown (left) are representative Western blot images.

Similar articles

Cited by

References

    1. Abrigo J., Rivera J. C., Simon F., Cabrera D., Cabello-Verrugio C. (2016). Transforming growth factor type beta (TGF-beta) requires reactive oxygen species to induce skeletal muscle atrophy. Cell. Signal. 28, 366–376. 10.1016/j.cellsig.2016.01.010 - DOI - PubMed
    1. Avitabile D., Ranieri D., Nicolussi A., D'Inzeo S., Capriotti A. L., Genovese L., et al. . (2014). Peroxiredoxin 2 nuclear levels are regulated by circadian clock synchronization in human keratinocytes. Int. J. Biochem. Cell Biol. 53, 24–34. 10.1016/j.biocel.2014.04.024 - DOI - PubMed
    1. Barbieri E., Sestili P. (2012). Reactive oxygen species in skeletal muscle signaling. J. Signal Transduct. 2012:982794. 10.1155/2012/982794 - DOI - PMC - PubMed
    1. Beharry A. W., Sandesara P. B., Roberts B. M., Ferreira L. F., Senf S. M., Judge A. R. (2014). HDAC1 activates FoxO and is both sufficient and required for skeletal muscle atrophy. J. Cell Sci. 127(Pt 7), 1441–1453. 10.1242/jcs.136390 - DOI - PMC - PubMed
    1. Bodine S. C., Baehr L. M. (2014). Skeletal muscle atrophy and the E3 ubiquitin ligases MuRF1 and MAFbx/atrogin-1. Am. J. Physiol. Endocrinol. Metab. 307, E469–E484. 10.1152/ajpendo.00204.2014 - DOI - PMC - PubMed