

Distinct Shift in Beta-Cell Glutaredoxin 5 Expression Is Mediated by Hypoxia and Lipotoxicity Both In Vivo and In Vitro
- PMID: 29593651
- PMCID: PMC5857561
- DOI: 10.3389/fendo.2018.00084
Distinct Shift in Beta-Cell Glutaredoxin 5 Expression Is Mediated by Hypoxia and Lipotoxicity Both In Vivo and In Vitro
Abstract
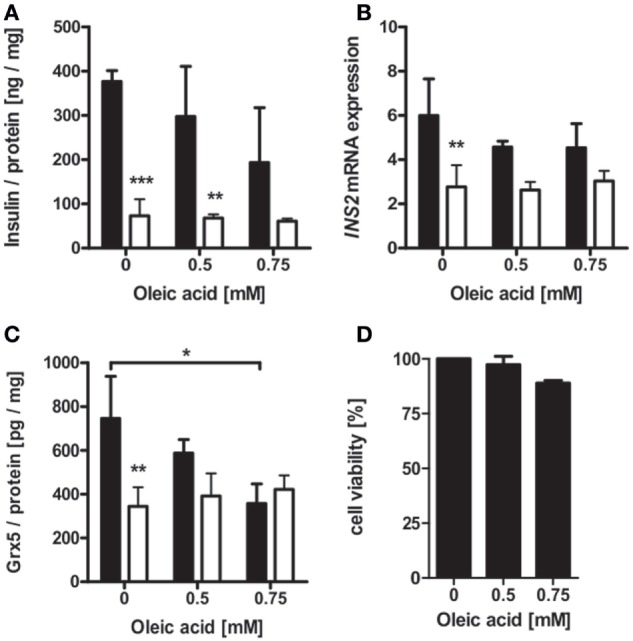
Histomorphological and functional alterations in pancreatic islet composition directly correlate with hyperglycemia severity. Progressive deterioration of metabolic control in subjects suffering from type 2 diabetes is predominantly caused by impaired beta-cell functionality. The glutaredoxin system is supposed to wield protective properties for beta-cells. Therefore, we sought to identify a correlation between the structural changes observed in diabetic pancreatic islets with altered glutaredoxin 5 expression, in order to determine an underlying mechanism of beta-cell impairment. Islets of db/db mice presenting with uncontrolled diabetes were assessed in terms of morphological structure and insulin, glucagon, and glutaredoxin 5 expression. MIN6 cell function and glutaredoxin 5 expression were analyzed after exposure to oleic acid and hypoxia. Islets of diabese mice were marked by typical remodeling and distinct reduction of, and shifts, in localization of glutaredoxin 5-positive cells. These islets featured decreased glutaredoxin 5 as well as insulin and glucagon content. In beta-cell culture, glutaredoxin 5 protein and mRNA expression were decreased by hypoxia and oleic acid but not by leptin treatment. Our study demonstrates that glutaredoxin 5 expression patterns are distinctively altered in islets of rodents presenting with uncontrolled diabesity. In vitro, reduction of islet-cell glutaredoxin 5 expression was mediated by hypoxia and oleic acid. Thus, glutaredoxin 5-deficiency in islets during diabetes may be caused by lipotoxicity and hypoxia.
Keywords: MIN6; db mouse; diabetes mellitus type 2; glutaredoxin; hypoxia; islet remodeling; lipotoxicity; rodent diabesity.
Figures


Similar articles
-
Loss and Recovery of Glutaredoxin 5 Is Inducible by Diet in a Murine Model of Diabesity and Mediated by Free Fatty Acids In Vitro.Antioxidants (Basel). 2022 Apr 15;11(4):788. doi: 10.3390/antiox11040788. Antioxidants (Basel). 2022. PMID: 35453472 Free PMC article.
-
Estrogenic restoration of functional pancreatic islet cytoarchitecture in diabetes (db/db) mutant C57BL/KsJ mice: relationship to estradiol localization, systemic glycemia, and persistent hyperinsulinemia.Cell Tissue Res. 2005 Feb;319(2):231-42. doi: 10.1007/s00441-004-1019-y. Epub 2004 Nov 20. Cell Tissue Res. 2005. PMID: 15654653
-
beta-cell failure in diabetes and preservation by clinical treatment.Endocr Rev. 2007 Apr;28(2):187-218. doi: 10.1210/10.1210/er.2006-0038. Epub 2007 Mar 12. Endocr Rev. 2007. PMID: 17353295 Review.
-
Taspoglutide, a novel human once-weekly GLP-1 analogue, protects pancreatic β-cells in vitro and preserves islet structure and function in the Zucker diabetic fatty rat in vivo.Diabetes Obes Metab. 2011 Apr;13(4):326-36. doi: 10.1111/j.1463-1326.2010.01352.x. Diabetes Obes Metab. 2011. PMID: 21205124
-
MicroRNA Sequences Modulated by Beta Cell Lipid Metabolism: Implications for Type 2 Diabetes Mellitus.Biology (Basel). 2021 Jun 15;10(6):534. doi: 10.3390/biology10060534. Biology (Basel). 2021. PMID: 34203703 Free PMC article. Review.
Cited by
-
Pharmacological blockade of the EP3 prostaglandin E2 receptor in the setting of type 2 diabetes enhances β-cell proliferation and identity and relieves oxidative damage.Mol Metab. 2021 Dec;54:101347. doi: 10.1016/j.molmet.2021.101347. Epub 2021 Oct 6. Mol Metab. 2021. PMID: 34626853 Free PMC article.
-
Lipotoxic Impairment of Mitochondrial Function in β-Cells: A Review.Antioxidants (Basel). 2021 Feb 15;10(2):293. doi: 10.3390/antiox10020293. Antioxidants (Basel). 2021. PMID: 33672062 Free PMC article. Review.
-
Loss and Recovery of Glutaredoxin 5 Is Inducible by Diet in a Murine Model of Diabesity and Mediated by Free Fatty Acids In Vitro.Antioxidants (Basel). 2022 Apr 15;11(4):788. doi: 10.3390/antiox11040788. Antioxidants (Basel). 2022. PMID: 35453472 Free PMC article.
-
Hypoxia Affects the Antioxidant Activity of Glutaredoxin 3 in Scylla paramamosain through Hypoxia Response Elements.Antioxidants (Basel). 2022 Dec 29;12(1):76. doi: 10.3390/antiox12010076. Antioxidants (Basel). 2022. PMID: 36670937 Free PMC article.
References
LinkOut - more resources
Full Text Sources
Other Literature Sources
Molecular Biology Databases
Miscellaneous