Regulation of Human Natural Killer Cell IFN-γ Production by MicroRNA-146a via Targeting the NF-κB Signaling Pathway
- PMID: 29593706
- PMCID: PMC5854688
- DOI: 10.3389/fimmu.2018.00293
Regulation of Human Natural Killer Cell IFN-γ Production by MicroRNA-146a via Targeting the NF-κB Signaling Pathway
Abstract
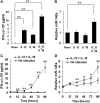
Natural killer (NK) cells are one group of innate lymphocytes that are important for host defense against malignancy and viruses. MicroRNAs (miRNAs) play a critical role in regulating responses of immune cells including NK cells. Accumulating evidence suggests that miR-146a is involved in the regulation of immune responses. However, the mechanism by which miR-146a regulates NK cell function is largely unknown. In the current study, we found that miR-146a intrinsically regulated NK cell function. Forced overexpression of miR-146a decreased IFN-γ production, whereas downregulation of miR-146a by anti-miR-146a significantly enhanced IFN-γ production in the human NK-92 cell line and primary human NK cells upon stimulation with IL-12 or co-stimulation with IL-12 and IL-18. Mechanistically, miR-146a regulated IFN-γ production via NF-κB, as evidenced in NK-92 cells, by downregulation of NF-κB p65 phosphorylation when miR-146a was overexpressed but upregulation of NF-κB p65 phosphorylation when anti-miR-146a was overexpressed. miR-146a directly targeted IRAK1 and TRAF6, the upstream signaling components of the NF-κB signaling pathway. This direct targeting mechanism confirmed the above gain- and loss-of-function approaches. However, the potent IFN-γ-producing subset, CD56bright NK cells, expressed higher levels of miR-146a than the lesser IFN-γ-producing subset, CD56dim NK cells. We also observed that co-stimulation of IL-12 and IL-18 significantly increased miR-146a expression in bulk NK cells and in the CD56bright subset in a time-dependent manner, correlating with augmented IFN-γ production. These data suggest that miR-146a plays a negative role in IFN-γ production by human NK cells and this miRNA may be critical in preventing NK cells from being super activated and overproducing IFN-γ.
Keywords: IFN-γ; IRAK1; NF-κB; TRAF6; miR-146a; microRNA; natural killer cells.
Figures


Similar articles
-
Dexmedetomidine exerts cardioprotective effect through miR-146a-3p targeting IRAK1 and TRAF6 via inhibition of the NF-κB pathway.Biomed Pharmacother. 2021 Jan;133:110993. doi: 10.1016/j.biopha.2020.110993. Epub 2020 Nov 18. Biomed Pharmacother. 2021. PMID: 33220608
-
MicroRNA-146a and microRNA-146b regulate human dendritic cell apoptosis and cytokine production by targeting TRAF6 and IRAK1 proteins.J Biol Chem. 2015 Jan 30;290(5):2831-41. doi: 10.1074/jbc.M114.591420. Epub 2014 Dec 11. J Biol Chem. 2015. PMID: 25505246 Free PMC article.
-
MicroRNA-155 tunes both the threshold and extent of NK cell activation via targeting of multiple signaling pathways.J Immunol. 2013 Dec 15;191(12):5904-13. doi: 10.4049/jimmunol.1301950. Epub 2013 Nov 13. J Immunol. 2013. PMID: 24227772 Free PMC article.
-
Regulation of the MIR155 host gene in physiological and pathological processes.Gene. 2013 Dec 10;532(1):1-12. doi: 10.1016/j.gene.2012.12.009. Epub 2012 Dec 14. Gene. 2013. PMID: 23246696 Review.
-
Regulatory pathways involved in the infection-induced production of IFN-gamma by NK cells.Microbes Infect. 2002 Dec;4(15):1531-8. doi: 10.1016/s1286-4579(02)00036-9. Microbes Infect. 2002. PMID: 12505525 Review.
Cited by
-
Alteration of the IFN-Pathway by Human Papillomavirus Proteins: Antiviral Immune Response Evasion Mechanism.Biomedicines. 2022 Nov 17;10(11):2965. doi: 10.3390/biomedicines10112965. Biomedicines. 2022. PMID: 36428532 Free PMC article. Review.
-
New miRNA Signature Heralds Human NK Cell Subsets at Different Maturation Steps: Involvement of miR-146a-5p in the Regulation of KIR Expression.Front Immunol. 2018 Oct 15;9:2360. doi: 10.3389/fimmu.2018.02360. eCollection 2018. Front Immunol. 2018. PMID: 30374356 Free PMC article.
-
Interferon-γ: teammate or opponent in the tumour microenvironment?Nat Rev Immunol. 2022 Mar;22(3):158-172. doi: 10.1038/s41577-021-00566-3. Epub 2021 Jun 21. Nat Rev Immunol. 2022. PMID: 34155388 Free PMC article. Review.
-
α-Pinene Enhances the Anticancer Activity of Natural Killer Cells via ERK/AKT Pathway.Int J Mol Sci. 2021 Jan 11;22(2):656. doi: 10.3390/ijms22020656. Int J Mol Sci. 2021. PMID: 33440866 Free PMC article.
-
Recent Advances of RNA m6A Modifications in Cancer Immunoediting and Immunotherapy.Cancer Treat Res. 2023;190:49-94. doi: 10.1007/978-3-031-45654-1_3. Cancer Treat Res. 2023. PMID: 38112999
References
Publication types
MeSH terms
Substances
Grants and funding
LinkOut - more resources
Full Text Sources
Other Literature Sources
Research Materials
Miscellaneous

