

Heterologous Prime-Boost Combinations Highlight the Crucial Role of Adjuvant in Priming the Immune System
- PMID: 29593710
- PMCID: PMC5857569
- DOI: 10.3389/fimmu.2018.00380
Heterologous Prime-Boost Combinations Highlight the Crucial Role of Adjuvant in Priming the Immune System
Abstract
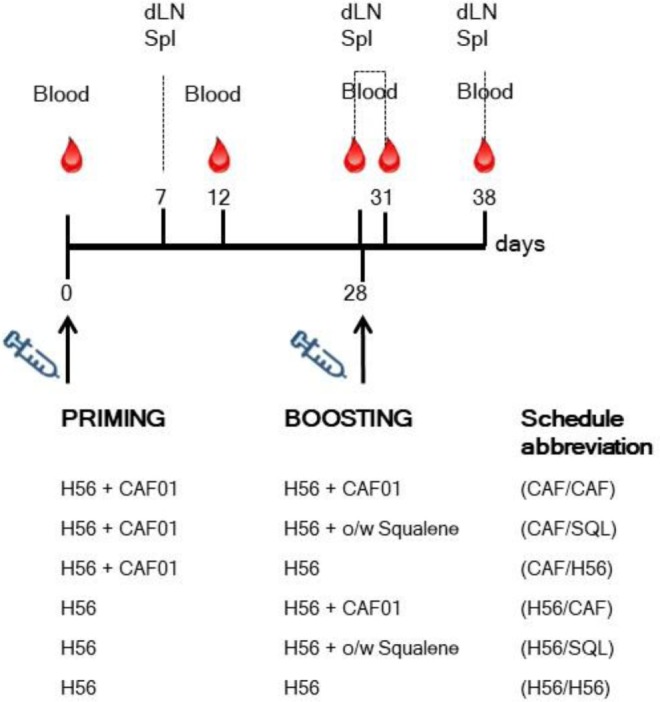
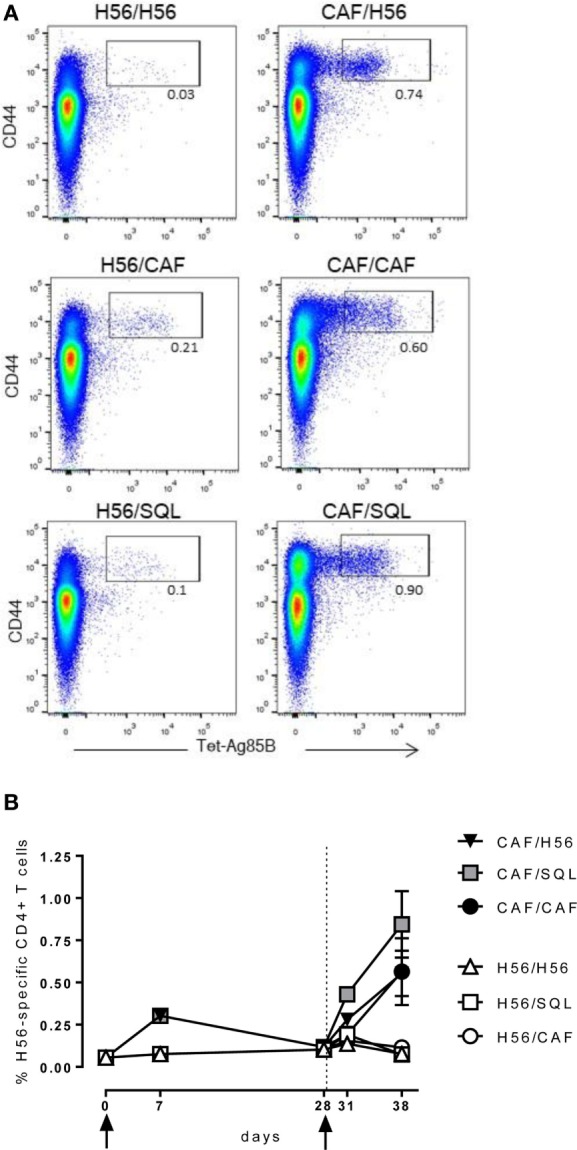
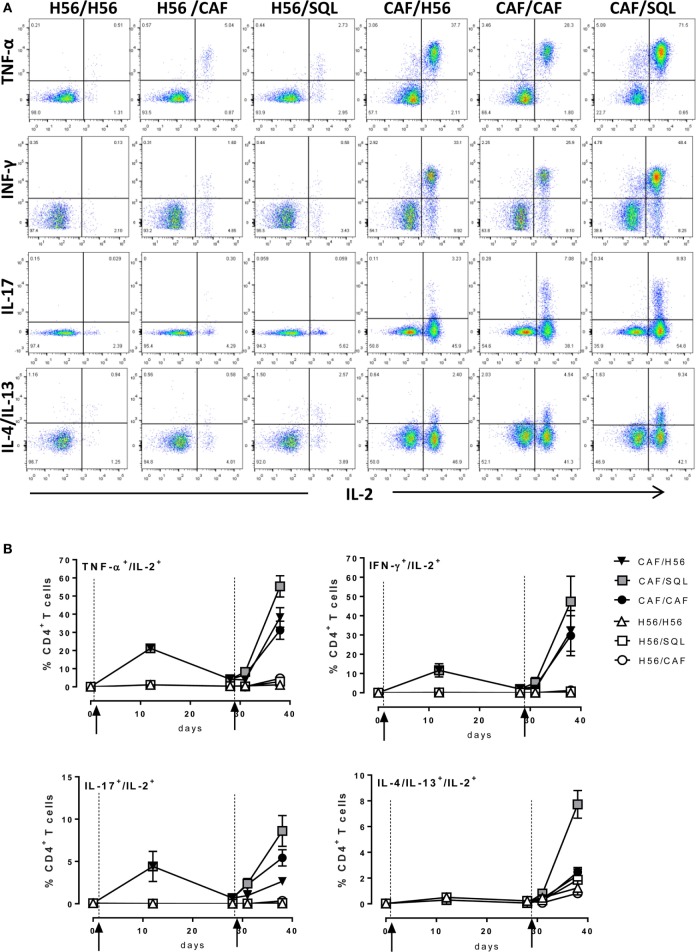
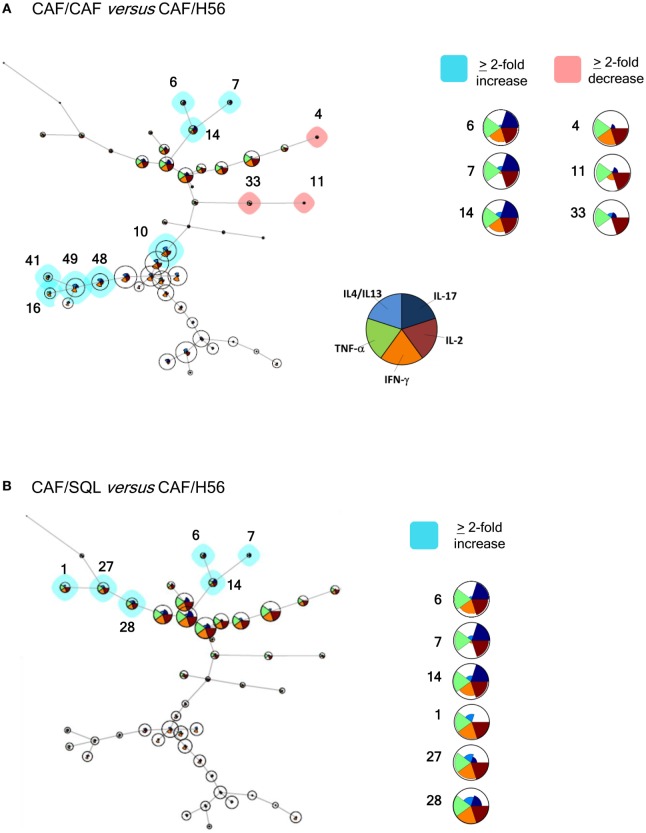
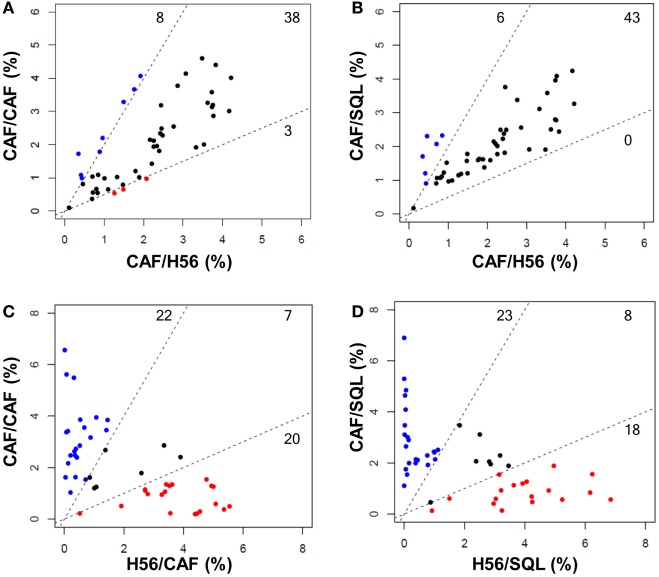
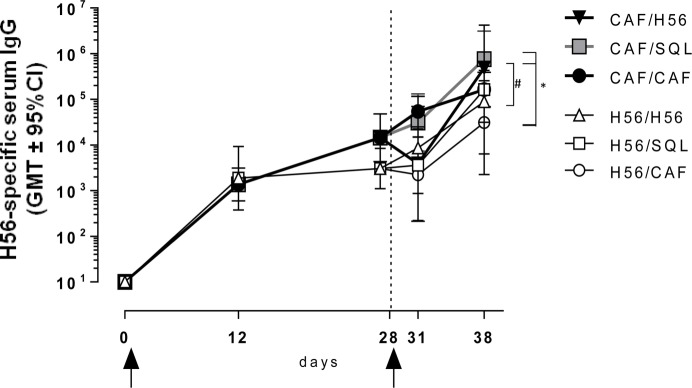
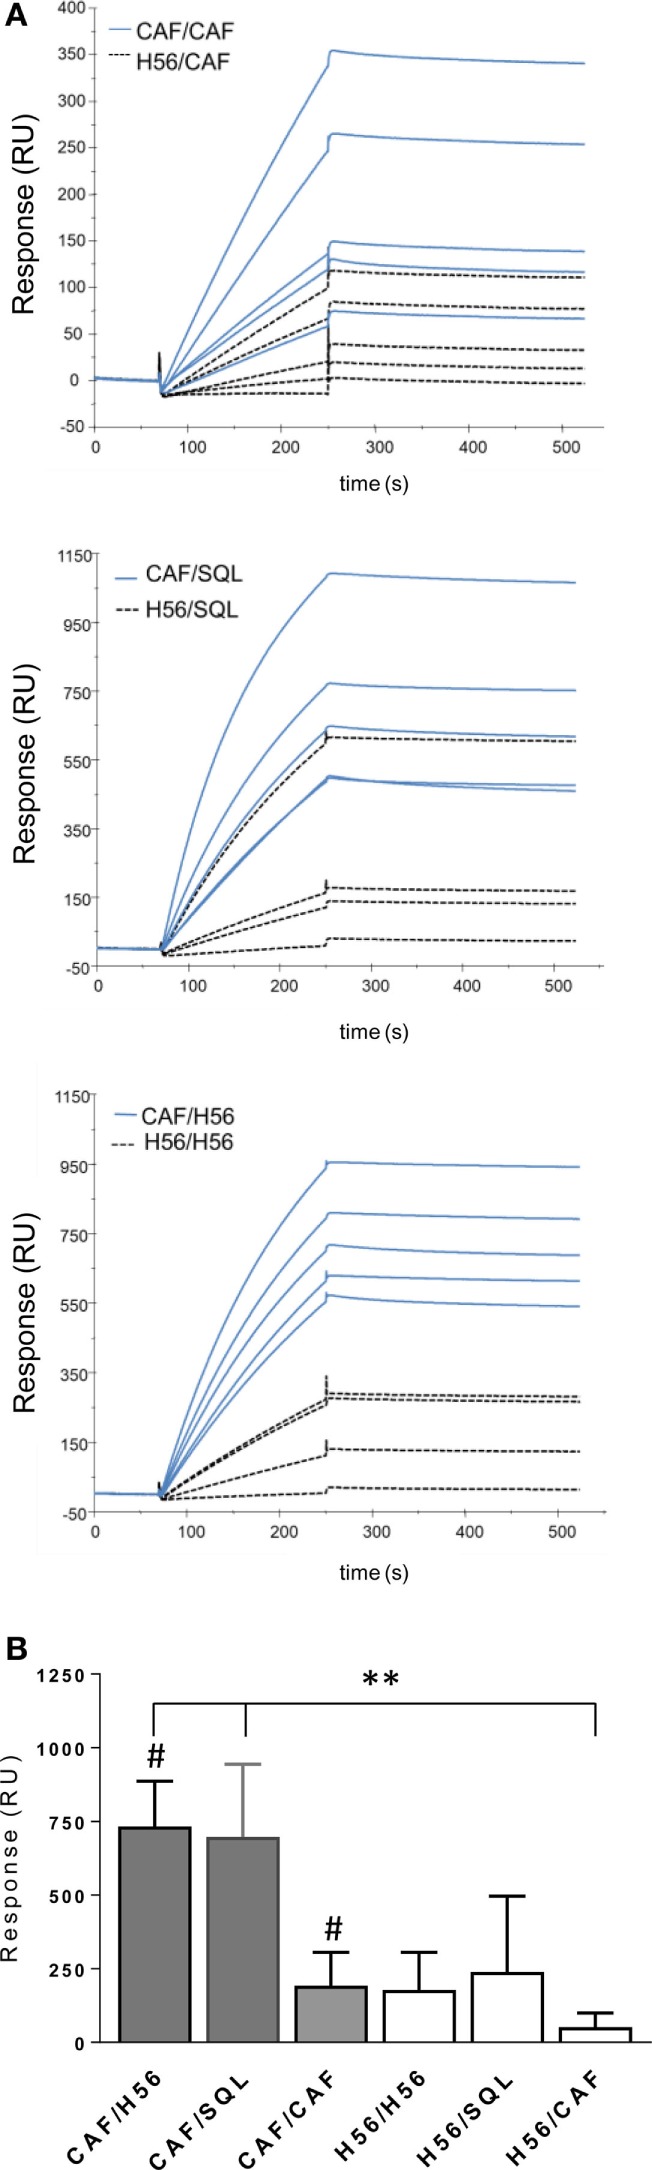
The induction and modulation of the immune response to vaccination can be rationally designed by combining different vaccine formulations for priming and boosting. Here, we investigated the impact of heterologous prime-boost approaches on the vaccine-specific cellular and humoral responses specific for a mycobacterial vaccine antigen. C57BL/6 mice were primed with the chimeric vaccine antigen H56 administered alone or with the CAF01 adjuvant, and boosted with H56 alone, or combined with CAF01 or with the squalene-based oil-in-water emulsion adjuvant (o/w squalene). A strong secondary H56-specific CD4+ T cell response was recalled by all the booster vaccine formulations when mice had been primed with H56 and CAF01, but not with H56 alone. The polyfunctional nature of T helper cells was analyzed and visualized with the multidimensional flow cytometry FlowSOM software, implemented as a package of the R environment. A similar cytokine profile was detected in groups primed with H56 + CAF01 and boosted with or without adjuvant, except for some clusters of cells expressing high level of IL-17 together with TNF-α, IL-2, and IFN-γ, that were significantly upregulated only in groups boosted with the adjuvants. On the contrary, the comparison between groups primed with or without the adjuvant showed a completely different clusterization of cells, strengthening the impact of the formulation used for primary immunization on the profiling of responding cells. The presence of the CAF01 adjuvant in the priming formulation deeply affected also the secondary humoral response, especially in groups boosted with H56 alone or o/w squalene. In conclusion, the presence of CAF01 adjuvant in the primary immunization is crucial for promoting primary T and B cell responses that can be efficiently reactivated by booster immunization also performed with antigen alone.
Keywords: CAF01; T cells; adjuvants; computational flow cytometry; intracellular cytokines; prime-boost regimens; priming.
Figures
Similar articles
-
Transcriptomics of the Vaccine Immune Response: Priming With Adjuvant Modulates Recall Innate Responses After Boosting.Front Immunol. 2018 Jun 5;9:1248. doi: 10.3389/fimmu.2018.01248. eCollection 2018. Front Immunol. 2018. PMID: 29922291 Free PMC article.
-
Intrapulmonary (i.pulmon.) Pull Immunization With the Tuberculosis Subunit Vaccine Candidate H56/CAF01 After Intramuscular (i.m.) Priming Elicits a Distinct Innate Myeloid Response and Activation of Antigen-Presenting Cells Than i.m. or i.pulmon. Prime Immunization Alone.Front Immunol. 2020 May 7;11:803. doi: 10.3389/fimmu.2020.00803. eCollection 2020. Front Immunol. 2020. PMID: 32457748 Free PMC article.
-
Heterologous prime-boost immunization combining parenteral and mucosal routes with different adjuvants mounts long-lived CD4+ T cell responses in lungs.Front Immunol. 2025 Jul 1;16:1599713. doi: 10.3389/fimmu.2025.1599713. eCollection 2025. Front Immunol. 2025. PMID: 40666512 Free PMC article.
-
The role of adjuvants and delivery systems in modulation of immune response to vaccines.Adv Exp Med Biol. 1996;397:105-13. doi: 10.1007/978-1-4899-1382-1_15. Adv Exp Med Biol. 1996. PMID: 8718589 Review. No abstract available.
-
Cellular response to mycobacteria: balancing protection and pathology.Trends Immunol. 2011 Feb;32(2):66-72. doi: 10.1016/j.it.2010.12.001. Epub 2011 Jan 6. Trends Immunol. 2011. PMID: 21216195 Free PMC article. Review.
Cited by
-
Ginseng Stem-Leaf Saponins in Combination with Selenium Promote the Immune Response in Neonatal Mice with Maternal Antibody.Vaccines (Basel). 2020 Dec 11;8(4):755. doi: 10.3390/vaccines8040755. Vaccines (Basel). 2020. PMID: 33322647 Free PMC article.
-
Parenteral Vaccination With a Tuberculosis Subunit Vaccine in Presence of Retinoic Acid Provides Early but Transient Protection to M. Tuberculosis Infection.Front Immunol. 2019 May 3;10:934. doi: 10.3389/fimmu.2019.00934. eCollection 2019. Front Immunol. 2019. PMID: 31130946 Free PMC article.
-
Predictive Markers of Immunogenicity and Efficacy for Human Vaccines.Vaccines (Basel). 2021 Jun 1;9(6):579. doi: 10.3390/vaccines9060579. Vaccines (Basel). 2021. PMID: 34205932 Free PMC article. Review.
-
Optimized Protocol for the Detection of Multifunctional Epitope-Specific CD4+ T Cells Combining MHC-II Tetramer and Intracellular Cytokine Staining Technologies.Front Immunol. 2019 Oct 9;10:2304. doi: 10.3389/fimmu.2019.02304. eCollection 2019. Front Immunol. 2019. PMID: 31649661 Free PMC article.
-
Transcriptomics of the Vaccine Immune Response: Priming With Adjuvant Modulates Recall Innate Responses After Boosting.Front Immunol. 2018 Jun 5;9:1248. doi: 10.3389/fimmu.2018.01248. eCollection 2018. Front Immunol. 2018. PMID: 29922291 Free PMC article.
References
-
- Ciabattini A, Prota G, Christensen D, Andersen P, Pozzi G, Medaglini D. Characterization of the antigen-specific CD4(+) T cell response induced by prime-boost strategies with CAF01 and CpG adjuvants administered by the intranasal and subcutaneous routes. Front Immunol (2015) 6:430.10.3389/fimmu.2015.00430 - DOI - PMC - PubMed
Publication types
MeSH terms
Substances
Grants and funding
LinkOut - more resources
Full Text Sources
Other Literature Sources
Medical
Research Materials