. 2018 Mar 13:9:487.
doi: 10.3389/fimmu.2018.00487. eCollection 2018.

A Distinct T Follicular Helper Cell Subset Infiltrates the Brain in Murine Neuropsychiatric Lupus

Affiliations

A Distinct T Follicular Helper Cell Subset Infiltrates the Brain in Murine Neuropsychiatric Lupus

Shweta Jain et al. Front Immunol. .

Abstract

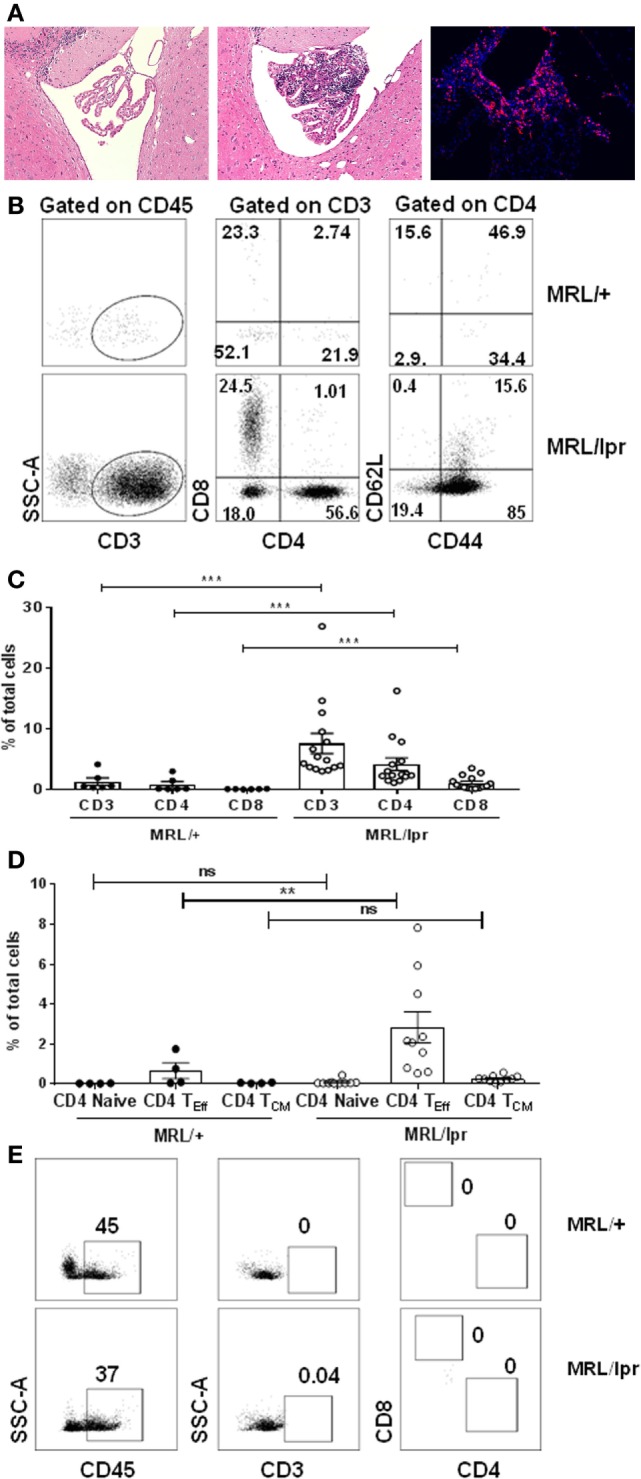
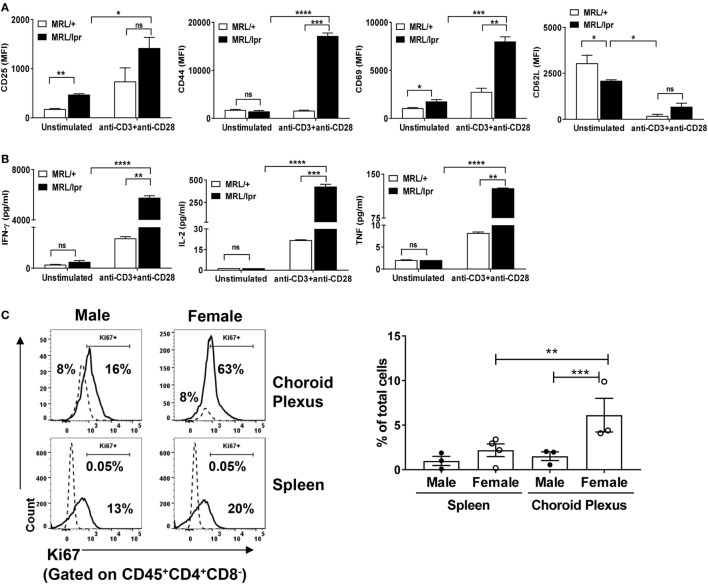
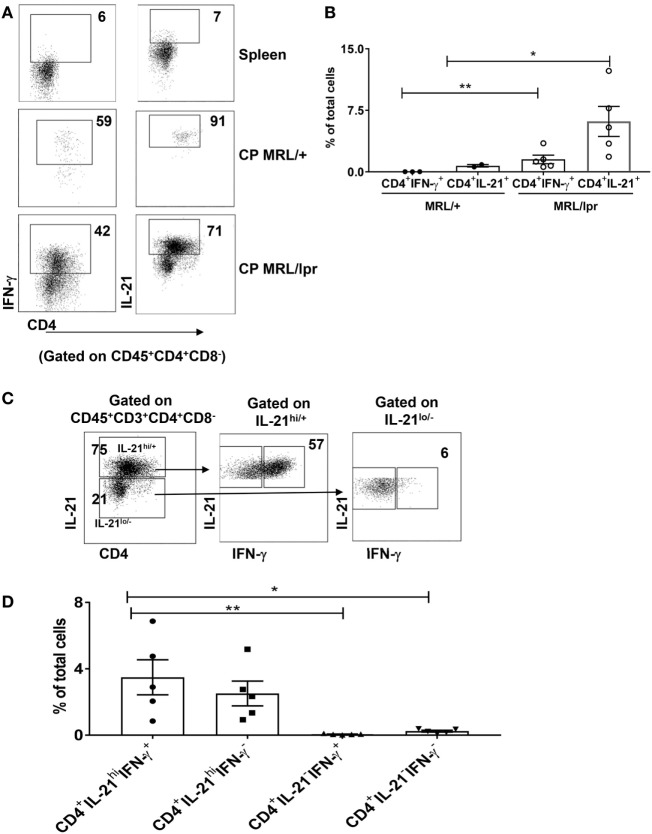
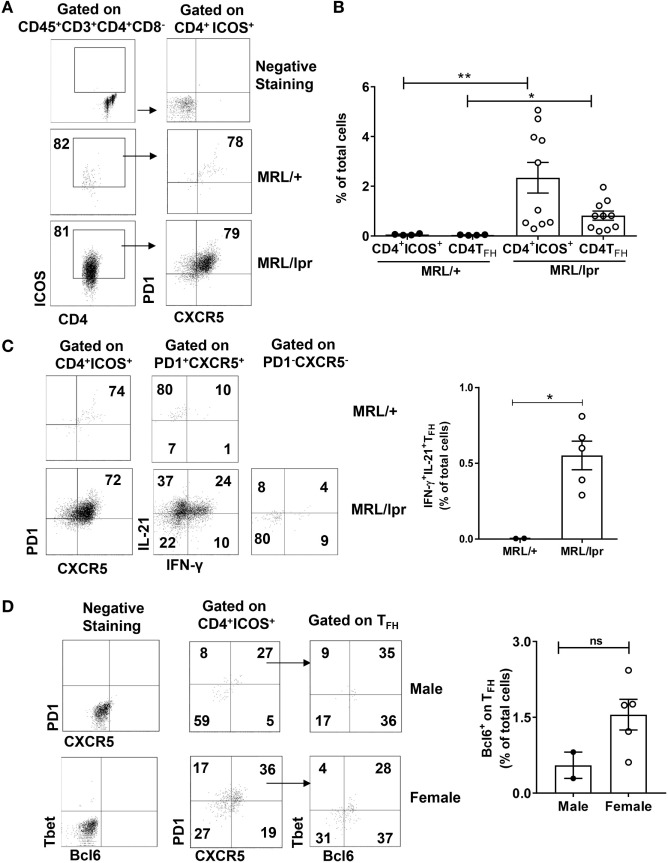
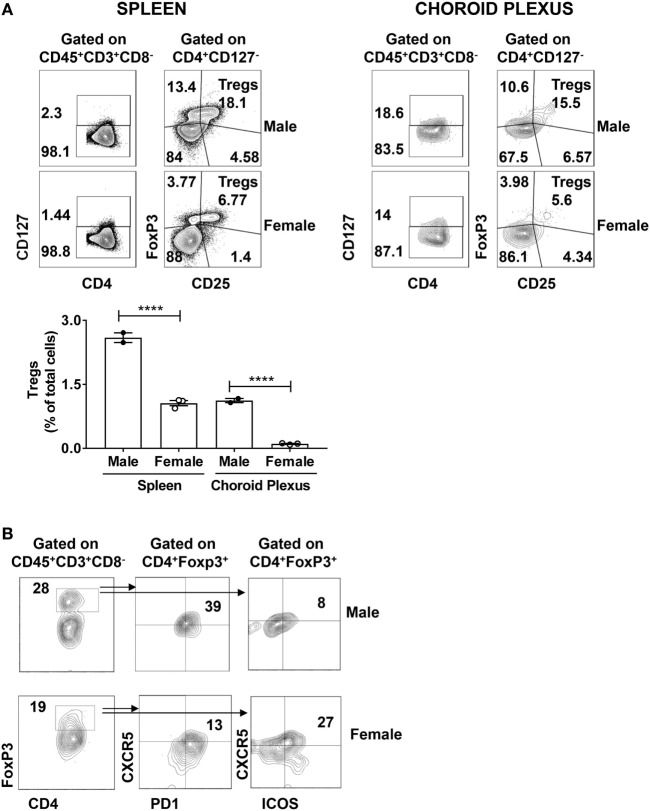
Neuropsychiatric symptoms in systemic lupus erythematosus (SLE) are not uncommon, yet the mechanisms underlying disease initiation and progression in the brain are incompletely understood. Although the role of T cells in other lupus target organs such as the kidney is well defined, which T cells contribute to the pathogenesis of neuropsychiatric SLE is not known. The present study was aimed at characterizing the CD4 T cell populations that are present in the choroid plexus (CP) of MRL/MpJ-faslpr mice, the primary site of brain infiltration in this classic lupus mouse model which exhibits a prominent neurobehavioral phenotype. T cells infiltrating the CP of MRL/MpJ-faslpr mice were characterized and subset identification was done by multiparameter flow cytometry. We found that the infiltrating CD4 T cells are activated and have an effector phenotype. Importantly, CD4 T cells have a T follicular helper cell (TFH) like phenotype, as evidenced by their surface markers and signature cytokine, IL-21. In addition, CD4 TFH cells also secrete significant levels of IFN-γ and express Bcl-6, thereby conforming to a potentially pathogenic T helper population that can drive the disease progression. Interestingly, the regulatory axis comprising CD4 T regulatory cells is diminished. These results suggest that accumulation of CD4 TFH in the brain of MRL/MpJ-faslpr mice may contribute to the neuropsychiatric manifestations of SLE, and point to this T cell subset as a possible novel therapeutic candidate.

Keywords: MRL/lpr; T follicular helper cells; choroid plexus; neuropsychiatric lupus; systemic lupus erythematosus.


Figures

Figure 1
Figure 1
T cells infiltrate the choroid plexus of MRL/lpr mice. (A) Representative H&E staining of brain sections from 16-week-old control MRL/+ (left) and MRL/lpr (middle) mice are shown. The right panel demonstrates prominent immunofluorescent staining for CD4 in the choroid plexus of MRL/lpr mice. Magnification: 10×. (B–E) Single cell suspensions from choroid plexus of 16–18-week-old female MRL/+ and MRL/lpr were stained for the presence of T cells. (B) Comparative representative FACS plots showing CD3, CD4, and CD8 populations. CD4+ gated cells were further analyzed for the expression of effector (CD4 TEff; CD4+CD44+), naive (CD4+CD62L+), and central memory phenotypes (CD4 TCM; CD4+CD44+CD62L+). Values indicate percentage of parent cells. (C) Bar graphs depicting mean ± SEM of CD3, CD4, CD8 T cells as percentage of total cells. Each dot represents one mouse. MRL/+ (n = 6), and MRL/lpr (n = 15). (D) Bar graphs depicting CD4 naive, effector, and central memory T cells as percentage of total cells. Each dot represents one mouse. MRL/+ (n = 4), and MRL/lpr (n = 10). (E) Representative FACS plots showing absence of infiltrating T cells in tissue devoid of choroid plexus in MRL/+ and MRL/lpr mice. Data were analyzed using a Mann–Whitney test. **p < 0.01, ***p < 0.001.
Figure 2
Figure 2
Brain infiltrating T cells are activated. Sorted CD4+ T cells from choroid plexuses of 16–18-week-old female MRL/+ (n = 3) and MRL/lpr (n = 5) were stimulated in vitro with anti-CD3 and anti-CD28. (A) Cells were analyzed for the expression of T cell activation markers: CD25, CD44, CD69, and CD62L. (B) Culture supernatants were analyzed for the quantification of different cytokines by LEGENDplex. Bars represent mean ± SEM of duplicate wells, and the statistical significance was determined by the Holm-Sidak method with alpha = 0.05. (C) CD45+CD4+CD8 T cells from choroid plexus and spleen were stained for the expression of Ki67 (solid lines). Isotype control (dotted lines) were used to set positive and negative gates. Values in the histogram indicate percentage of parent (CD4) cells (left panel). The right panel shows the cumulative data depicting the percentage of Ki67+ in the total number of cells from spleen and choroid plexus of male (n = 3) and female (n = 3–4) mice. Data are represented as mean ± SEM of percentage of total cells. Each dot represents one mouse. p-Values were determined by one-way ANOVA. The p-values were calculated with an unpaired t-test. *p < 0.05, **p < 0.01, ***p < 0.001.
Figure 3
Figure 3
T cells infiltrating the brain predominantly secrete IFN-γ and IL-21. (A) Single cell suspensions from choroid plexus (CP) of 16–18-week-old female MRL/+ (n = 2–3) and MRL/lpr (n = 5) mice were stimulated with PMA and ionomycin for 6 h, and stained for intracellular IFN-γ and IL-21. Values in the FACS plots represent percentage of parent (CD4+) population. (B) Bars represent mean ± SEM of the percentage of CD4+ IFN-γ+ cells and CD4+ IL-21+ cells from the total number of cells in the CP. (C) FACS plots showing relative expression of IFN-γ in IL-21hi and IL-21lo/neg cells. Values indicate percentage of parent population (indicated above each plot). (D) Graphs depict mean ± SEM of the percentage of CD4+IFN-γ+IL-21+, CD4+IFN-γIL-21+, CD4+IFN-γ+IL-21, and CD4+IFN-γIL-21 cells in the total number of cells in the CP of MRL/lpr mice. Each dot represents one mouse. PD1 and CXCR5 negative spleen T cells were used to set the negative gates for IFN-γ and IL-21 in this figure. The p-values were determined by unpaired two-tailed t-test with Welch’s correction. *p < 0.05, **p < 0.01.
Figure 4
Figure 4
Infiltrating T cells have a TFH phenotype. Single cell suspensions from choroid plexus of MRL/+ (n = 4), MRL/lpr male (n = 2), and MRL/lpr female (n = 10) mice were stained for the expression of CD4, ICOS, PD1, and CXCR5. (A) Comparative FACS plots showing CD4+ICOS+PD1+ CXCR5+ TFH cells. Values in the plots represent percentage of parent population (indicated above each plot). Negative staining controls are shown in the top two panels. (B) Quantitative data representing mean ± SEM of the total percentages of CD4+ICOS+ and CD4+ICOS+PD1+ CXCR5+ TFH cells. Each dot represents one mouse. (C) Representative FACS plots showing the expression of IL-21 and IFN-γ in PD1+CXCR5+ TFH cells and PD1CXCR5 T cells. Values in the plots represent percentage of parent population (indicated above each plot). Bar graphs indicate mean ± SEM of the total percentages of IL-21+ IFN-γ+ TFH cells (right panel). (D) Comparative FACS plots depicting the expression of Bcl6 on TFH cells (left panel). Values in the plots represent percentage of parent population (indicated above each plot). Bar graphs indicate mean ± SEM of the total percentages of Bcl6+ TFH cells (right panel). Negative staining controls are shown in the left two panels. The p-values were determined by unpaired two-tailed t-test with Welch’s correction. *p < 0.05, **p < 0.01.
Figure 5
Figure 5
Regulatory T cell populations are decreased in the brains of MRL/lpr mice. (A) Spleen and choroid plexus of MRL/+ and MRL/lpr mice were stained for the expression of CD4+CD127CD25+ FoxP3+ T regulatory cells (Tregs). Shown are the representative FACS plots of male (n = 2) and female (n = 3) MRL/lpr spleen (left) and choroid plexus (right). Values in the plots represent percentage of parent population (indicated above each plot). Bar graph represents mean ± SEM of the total percentages of Tregs in male and female spleen and choroid plexus, respectively. Each dot represents one mouse. The p-values were determined by one way ANOVA with Sidak’s multiple comparison test. ****p < 0.0001. (B) Choroid plexus cells from MRL/lpr male (n = 2) and MRL/lpr female (n = 5) mice were stained and analyzed for the presence of T follicular regulatory cells. FACS plots depict the expression of CXCR5+PD1+ (middle panel) or CXCR5+ICOS+ (right panel) cells on CD4+FoxP3+ (left panel) cells. Values in the plots represent percentage of parent population (indicated above each plot).

Similar articles

Cited by

References

    1. The American college of rheumatology nomenclature and case definitions for neuropsychiatric lupus syndromes. Arthritis Rheum (1999) 42(4):599–608.10.1002/1529-0131(199904)42:4<599::AID-ANR2>3.0.CO;2-F - DOI - PubMed
    1. Kivity S, Agmon-Levin N, Zandman-Goddard G, Chapman J, Shoenfeld Y. Neuropsychiatric lupus: a mosaic of clinical presentations. BMC Med (2015) 13:43.10.1186/s12916-015-0269-8 - DOI - PMC - PubMed
    1. Stielke S, Keilhoff G, Kirches E, Mertens PR, Neumann KH, Tsokos GC, et al. Adhesion molecule expression precedes brain damages of lupus-prone mice and correlates with kidney pathology. J Neuroimmunol (2012) 252(1–2):24–32.10.1016/j.jneuroim.2012.07.011 - DOI - PubMed
    1. Ellis SG, Verity MA. Central nervous system involvement in systemic lupus erythematosus: a review of neuropathologic findings in 57 cases, 1955 – 1977. Semin Arthritis Rheum (1979) 8(3):212–21.10.1016/S0049-0172(79)80009-8 - DOI - PubMed
    1. Moulton VR, Tsokos GC. T cell signaling abnormalities contribute to aberrant immune cell function and autoimmunity. J Clin Invest (2015) 125(6):2220–7.10.1172/JCI78087 - DOI - PMC - PubMed

Publication types

MeSH terms