. 2018 Mar 9:9:271.
doi: 10.3389/fpls.2018.00271. eCollection 2018.

Genetic Dissection of End-Use Quality Traits in Adapted Soft White Winter Wheat

Affiliations

Genetic Dissection of End-Use Quality Traits in Adapted Soft White Winter Wheat

Kendra L Jernigan et al. Front Plant Sci. .

Abstract

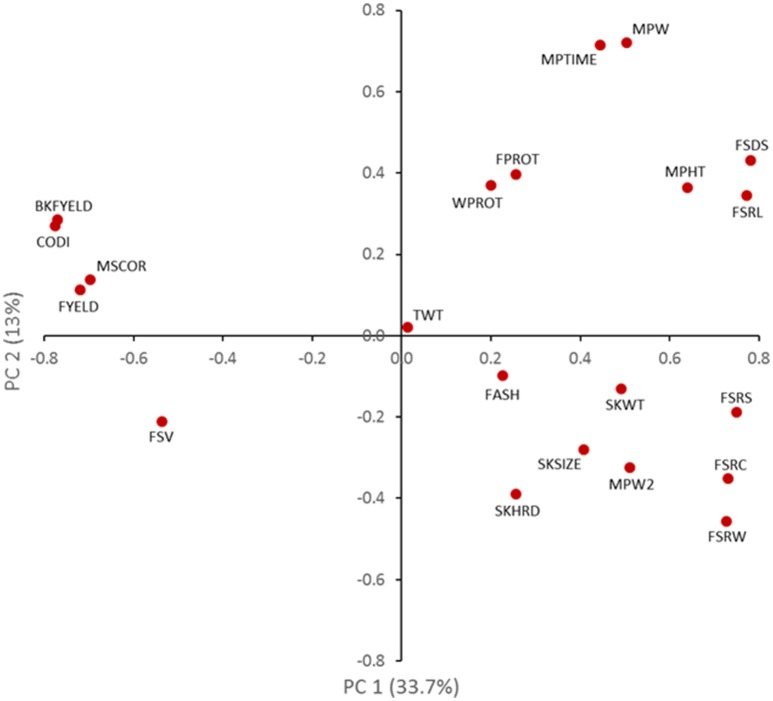
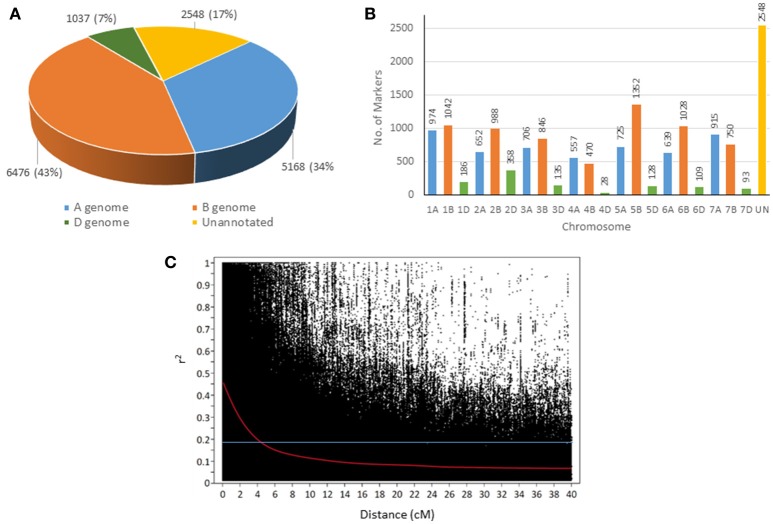
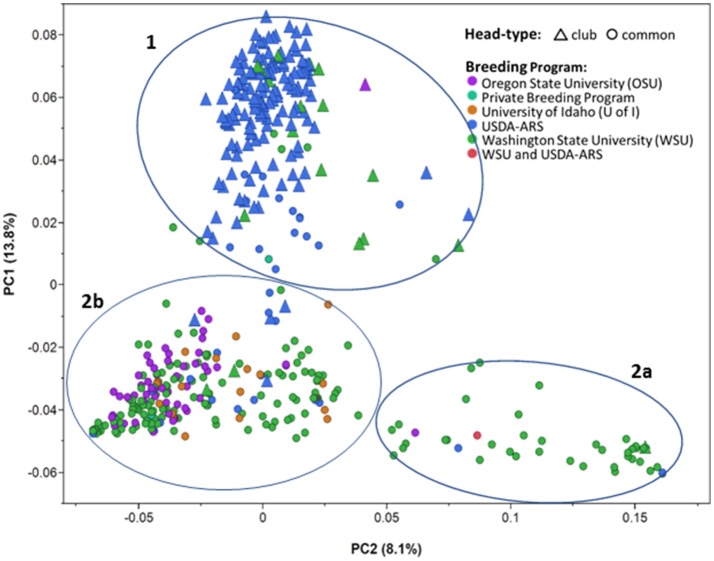
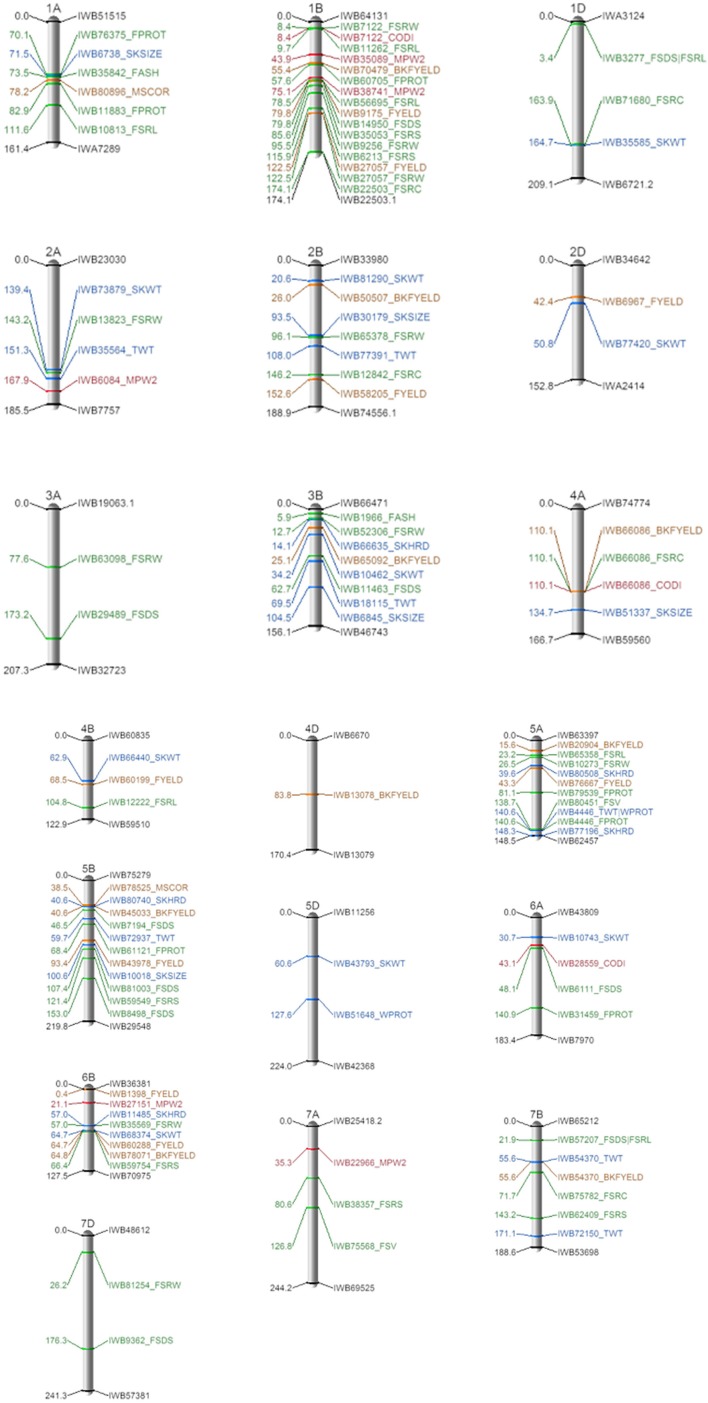
Soft white wheat is used in domestic and foreign markets for various end products requiring specific quality profiles. Phenotyping for end-use quality traits can be costly, time-consuming and destructive in nature, so it is advantageous to use molecular markers to select experimental lines with superior traits. An association mapping panel of 469 soft white winter wheat cultivars and advanced generation breeding lines was developed from regional breeding programs in the U.S. Pacific Northwest. This panel was genotyped on a wheat-specific 90 K iSelect single nucleotide polymorphism (SNP) chip. A total of 15,229 high quality SNPs were selected and combined with best linear unbiased predictions (BLUPs) from historical phenotypic data of the genotypes in the panel. Genome-wide association mapping was conducted using the Fixed and random model Circulating Probability Unification (FarmCPU). A total of 105 significant marker-trait associations were detected across 19 chromosomes. Potentially new loci for total flour yield, lactic acid solvent retention capacity, flour sodium dodecyl sulfate sedimentation and flour swelling volume were also detected. Better understanding of the genetic factors impacting end-use quality enable breeders to more effectively discard poor quality germplasm and increase frequencies of favorable end-use quality alleles in their breeding populations.

Keywords: Pacific Northwest; association mapping; end-use quality; linkage disequilibrium; plant breeding; soft white wheat.


Figures

Figure 1
Figure 1
Biplot of principal components showing the phenotypic correlation of end-use quality traits in a soft white winter wheat diversity panel. SKHRD, kernel hardness; SKSIZE, kernel size; SKWT, kernel weight; TWT, test weight; WPROT, gain protein; BKFYELD, break flour yield; FYELD, total flour yield; MSCOR, milling score; FASH, flour ash; FPROT, flour protein; FSDS, flour SDS sedimentation; FSRC, carbonate solvent retention capacity; FSRL, lactic acid solvent retention capacity; FSRS, sucrose solvent retention capacity; FSRW, water solvent retention capacity; FSV, flour swelling volume; MPTIME, mixograph peak time; MPW, mixo graph height; MPW, mixograph width; MPW2, mixograph width 2 mins; CODI, cookie diameter.
Figure 2
Figure 2
Distribution of 15,229 SNP markers across the genome (A) and different chromosomes (B). A scatterplot (C) showing the decline of genome-wide linkage disequilibrium (LD) r2 over genetic distances (cM). The horizontal line corresponds to the 95th percentile of distributions of unlinked (>40 cM) markers at r2 = 0.18.
Figure 3
Figure 3
Principal component analysis (PCA) of a soft white winter wheat diversity panel using 15,229 SNP markers from all genomes showing two major sub-populations representing head type: club (1) or lax from (2) wheat breeding programs in the PNW. The lax form group can be further subdivided into two groups (2a,b). The phenotypic variation explained by each PC axis are as follows: PC1 = 13.8% and PC2 = 8.1%.
Figure 4
Figure 4
Location of the 105 MTAs for end-use quality traits detected in the Pacific Northwest soft white winter wheat diversity panel. Genetic linkage maps of the chromosomes are based on the wheat consensus SNP map (Wang et al., 2014). Values on the left are genetic distance in centimorgan (cM). On the right, SNP ID and the associated end-used quality traits. See Table 1 for complete description of trait abbreviations. Trait groupings are color coded. Blue, grain characteristics; Green, flour parameters; Brown, milling traits; Red, baking parameters. SKHRD, kernel hardness; SKSIZE, kernel size; SKWTkernel weight; TWT, test weight; WPROT, grain protein; BKFYELD, break flour yield; FYELO, total flour yield; MSCOR, milling score; FASH, flour ash; FPROT, flour protein; FSOS, flour SDS sedimentation; FSRC, carbonate solvent retention capacity; FSRL, lactic acid solvent retention capacity; FSRS, sucrose solvent retention capacity; FSRW, water solvent retention capacity; FSV, flour swelling volume; MPW2, mixograph width 2 mins; CODI, cookie diameter.

References

    1. AACC International (2008). Approved Methods of Analysis, 11th Edn. Paul, MN: AACC International, St.
    1. Bernardo R. (1994). Prediction of maize single-cross performance using RFLPs and information from related hybrids. Crop Sci. 34, 20–25. 10.2135/cropsci1994.0011183X003400010003x - DOI
    1. Bernardo R. (2008). Molecular markers and selection for complex traits in plants: learning from the last 20 years. Crop Sci. 48, 1649–1664. 10.2135/cropsci2008.03.0131 - DOI
    1. Bhave M., Morris C. (2008a). Molecular genetics of puroindolines and related genes: allelic diversity in wheat and other grasses. Plant Mol. Biol. 66, 205–219. 10.1007/s11103-007-9263-7 - DOI - PubMed
    1. Bhave M., Morris C. (2008b). Molecular genetics of puroindolines and related genes: regulation of expression, membrane binding properties and applications. Plant Mol. Biol. 66, 221–231. 10.1007/s11103-007-9264-6 - DOI - PubMed

LinkOut - more resources