

Expression of selected genes of dendritic and Treg cells in blood and skin of morphea patients treated with UVA1 phototherapy
- PMID: 29593811
- PMCID: PMC5868677
- DOI: 10.5114/aoms.2018.73469
Expression of selected genes of dendritic and Treg cells in blood and skin of morphea patients treated with UVA1 phototherapy
Abstract
Introduction: Morphea is a chronic autoimmune disease characterized by fibrosis of the skin. Dendritic cells (DC) and regulatory T cells (Tregs) play a significant role in development of autoimmune and tolerance mechanisms. The aim of the study was to establish the expression of selected genes of plasmacytoid and myeloid DC, Treg cells, and the microenvironment of cytokines (interleukin-17A (IL-17A), transforming growth factor β (TGF-β)) in blood and skin of morphea patients. In addition, the effect of UVA1 phototherapy on expression of the aforementioned genes was evaluated.
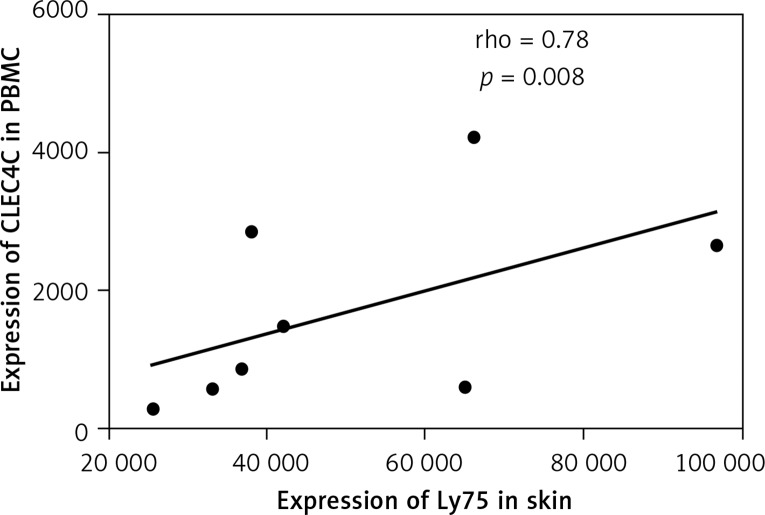
Material and methods: The study was performed on 15 blood and 10 skin samples from patients with morphea. The evaluation included expression of CLEC4C (C-type lectin domain family 4, member C receptor), Lymphocyte antigen 75 (LY75), Forkhead box p3 (foxp3) transcription factor, IL-17A and TGF-β genes in peripheral blood mononuclear cells (PBMC) and in skin samples both before and after UVA1 phototherapy using real-time polymerase chain reaction.
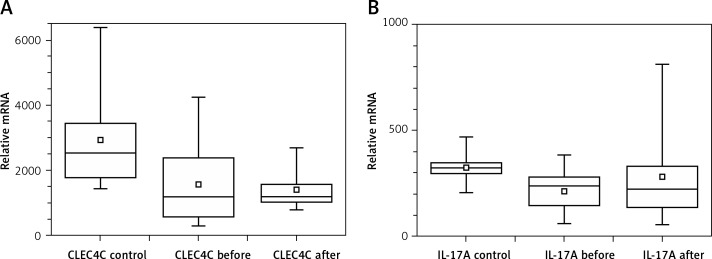
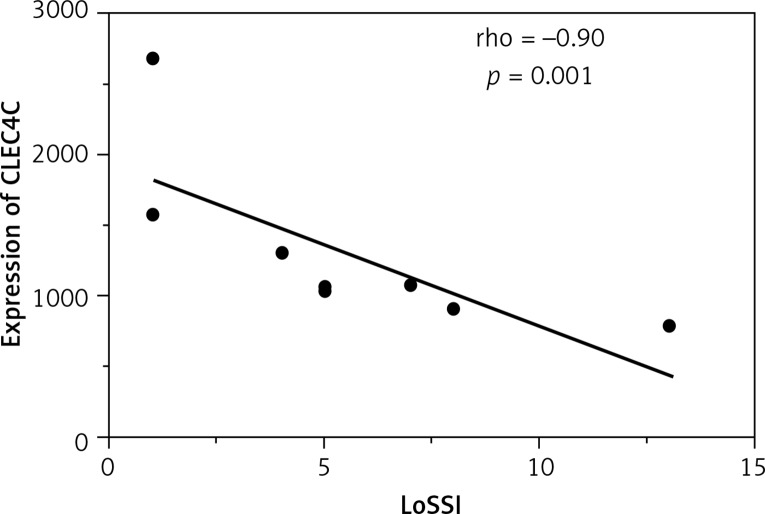
Results: The study revealed lower expression of CLEC4C before (p = 0.010) and after (p = 0.009) phototherapy and lower expression of IL-17A before (p = 0.038) phototherapy in PBMC of patients with morphea vs. the control group. Expression of CLEC4C in PBMC correlated negatively (rho = -0.90; p = 0.001) with activity of disease after phototherapy. No significant differences were found between expression of analysed genes before and after UVA1 therapy in PBMC and skin of morphea patients.
Conclusions: The results do not confirm the involvement of analysed subsets of DC and Tregs in UVA1 phototherapy in morphea, but point to CLEC4C as a possible biomarker associated with the disease activity.
Keywords: myeloid dendritic cells; plasmacytoid dendritic cells; regulatory T cells.
Figures


Similar articles
-
Effects of UVA1 Phototherapy on Expression of Human Endogenous Retroviral Sequence (HERV)-K10 gag in Morphea: A Preliminary Study.Med Sci Monit. 2017 Jan 28;23:505-512. doi: 10.12659/msm.897985. Med Sci Monit. 2017. PMID: 28130554 Free PMC article.
-
Interleukin-17A and interleukin-23 in morphea.Arch Med Sci. 2012 Dec 20;8(6):1089-95. doi: 10.5114/aoms.2012.32421. Epub 2012 Dec 19. Arch Med Sci. 2012. PMID: 23319986 Free PMC article.
-
Effectiveness of PUVA vs. UVA1 phototherapy in the treatment of morphea patients.Postepy Dermatol Alergol. 2022 Aug;39(4):757-761. doi: 10.5114/ada.2021.108437. Epub 2021 Aug 24. Postepy Dermatol Alergol. 2022. PMID: 36090739 Free PMC article.
-
The role of dendritic cells and regulatory T cells in the pathogenesis of morphea.Cent Eur J Immunol. 2015;40(1):103-8. doi: 10.5114/ceji.2015.50841. Epub 2015 Apr 22. Cent Eur J Immunol. 2015. PMID: 26155191 Free PMC article. Review.
-
UVA irradiation induced heme oxygenase-1: a novel phototherapy for morphea.Photochem Photobiol. 2015 Jan-Feb;91(1):210-20. doi: 10.1111/php.12342. Epub 2014 Nov 8. Photochem Photobiol. 2015. PMID: 25207998 Review.
Cited by
-
The Damaging Effects of Long UVA (UVA1) Rays: A Major Challenge to Preserve Skin Health and Integrity.Int J Mol Sci. 2022 Jul 26;23(15):8243. doi: 10.3390/ijms23158243. Int J Mol Sci. 2022. PMID: 35897826 Free PMC article. Review.
References
-
- Fett N. Scleroderma: nomenclature, etiology, pathogenesis, prognosis and treatments: Facts and controversies. Clin Dermatol. 2013;31:432–7. - PubMed
-
- Gołąb J, Jakóbisiak M, Lasek W, Stokłosa T. Immunology. Warsaw: Wydawnictwo Naukowe PWN; 2007. pp. 376–95.
LinkOut - more resources
Full Text Sources
Other Literature Sources
Research Materials