Novel 3D geometry and models of the lower regions of large trees for use in carbon accounting of primary forests
- PMID: 29593855
- PMCID: PMC5861447
- DOI: 10.1093/aobpla/ply015
Novel 3D geometry and models of the lower regions of large trees for use in carbon accounting of primary forests
Abstract
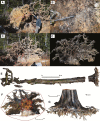
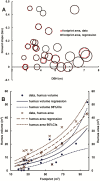
There is high uncertainty in the contribution of land-use change to anthropogenic climate change, especially pertaining to below-ground carbon loss resulting from conversion of primary-to-secondary forest. Soil organic carbon (SOC) and coarse roots are concentrated close to tree trunks, a region usually unmeasured during soil carbon sampling. Soil carbon estimates and their variation with land-use change have not been correspondingly adjusted. Our aim was to deduce allometric equations that will allow improvement of SOC estimates and tree trunk carbon estimates, for primary forest stands that include large trees in rugged terrain. Terrestrial digital photography, photogrammetry and GIS software were used to produce 3D models of the buttresses, roots and humus mounds of large trees in primary forests dominated by Eucalyptus regnans in Tasmania. Models of 29, in situ eucalypts were made and analysed. 3D models of example eucalypt roots, logging debris, rainforest tree species, fallen trees, branches, root and trunk slices, and soil profiles were also derived. Measurements in 2D, from earlier work, of three buttress 'logs' were added to the data set. The 3D models had high spatial resolution. The modelling allowed checking and correction of field measurements. Tree anatomical detail was formulated, such as buttress shape, humus volume, root volume in the under-sampled zone and trunk hollow area. The allometric relationships developed link diameter at breast height and ground slope, to SOC and tree trunk carbon, the latter including a correction for senescence. These formulae can be applied to stand-level carbon accounting. The formulae allow the typically measured, inter-tree SOC to be corrected for not sampling near large trees. The 3D models developed are irreplaceable, being for increasingly rare, large trees, and they could be useful to other scientific endeavours.
Keywords: 3D; allometric; buttress; humus mound; land-use emissions; primary forest; root volume; soil carbon.
Figures


Similar articles
-
Landscape-level validation of allometric relationships for carbon stock estimation reveals bias driven by soil type.Ecol Appl. 2019 Dec;29(8):e01987. doi: 10.1002/eap.1987. Epub 2019 Aug 30. Ecol Appl. 2019. PMID: 31359463
-
An assessment of the role of buttress roots in the carbon stocks of tropical forests.Front Plant Sci. 2025 May 1;16:1538583. doi: 10.3389/fpls.2025.1538583. eCollection 2025. Front Plant Sci. 2025. PMID: 40376163 Free PMC article.
-
Towards complete and harmonized assessment of soil carbon stocks and balance in forests: The ability of the Yasso07 model across a wide gradient of climatic and forest conditions in Europe.Sci Total Environ. 2017 Dec 1;599-600:1171-1180. doi: 10.1016/j.scitotenv.2017.03.298. Epub 2017 May 13. Sci Total Environ. 2017. PMID: 28511362
-
Influences of evergreen gymnosperm and deciduous angiosperm tree species on the functioning of temperate and boreal forests.Biol Rev Camb Philos Soc. 2015 May;90(2):444-66. doi: 10.1111/brv.12119. Epub 2014 Jun 11. Biol Rev Camb Philos Soc. 2015. PMID: 24916992 Review.
-
Conventional intensive logging promotes loss of organic carbon from the mineral soil.Glob Chang Biol. 2017 Jan;23(1):1-11. doi: 10.1111/gcb.13387. Epub 2016 Jul 13. Glob Chang Biol. 2017. PMID: 27273206 Review.
References
-
- Adkins MF. 2006. A burning issue: using fire to accelerate tree hollow formation in Eucalyptus species. Australian Forestry 69:107–113.
-
- Agisoft 2015. Agisoft Photoscan http://www.agisoft.com/ (1 March 2015).
-
- Ashton DH. 1975. The root and shoot development of Eucalyptus regnans F. Muell. Australian Journal of Botany 23:867–887.
-
- Ashton DH. 1981. Fire in tall open-forests (wet sclerophyll forests). In: Gill AM, Groves RH, Noble IR, eds. Fire and the Australian biota. Canberra, Australia: Australian Academy of Science, 339–366.
-
- AUSLIG 1990. Atlas of Australian resources, vegetation. Canberra, Australia: Australian Government Publishing Service.
LinkOut - more resources
Full Text Sources
Other Literature Sources

