Accurately Predicting Disordered Regions of Proteins Using Rosetta ResidueDisorder Application
- PMID: 29595057
- PMCID: PMC5897131
- DOI: 10.1021/acs.jpcb.8b01763
Accurately Predicting Disordered Regions of Proteins Using Rosetta ResidueDisorder Application
Abstract
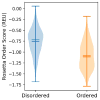
Although many proteins necessitate well-folded structures to properly instigate their biological functions, a large fraction of functioning proteins contain regions-known as intrinsically disordered protein regions-where stable structures are not likely to form. Notable functional roles of intrinsically disordered proteins are in transcriptional regulation, translation, and cellular signal transduction. Moreover, intrinsically disordered protein regions are highly abundant in many proteins associated with various human diseases, therefore these segments have become attractive drug targets for potential therapeutics. Over the past decades, numerous computational methods have been developed to accurately predict disordered regions of proteins. Here we introduce a user-friendly and reliable approach for the prediction of disordered protein regions using the structure prediction software Rosetta. Using 245 proteins from a benchmark data set (16 DisProt database proteins) and a test data set (229 proteins with NMR data), we use Rosetta to predict the global protein structures and then show that there is a statistically significant difference between Rosetta scores in disordered and ordered regions, with scores being less favorable in disordered regions. Furthermore, the difference in scores between ordered and disordered protein regions is sufficient to accurately identify disordered protein regions. As a result, our Rosetta ResidueDisorder method (benchmark data set prediction accuracy of 71.77% and independent test data set prediction accuracy of 65.37%) outperformed other established disorder prediction tools and did not exhibit a biased prediction toward either ordered or disordered regions. To facilitate usage, a Rosetta application has been developed for the Rosetta ResidueDisorder method.
Figures


Similar articles
-
Measuring Intrinsic Disorder and Tracking Conformational Transitions Using Rosetta ResidueDisorder.J Phys Chem B. 2019 Aug 22;123(33):7103-7112. doi: 10.1021/acs.jpcb.9b04333. Epub 2019 Aug 14. J Phys Chem B. 2019. PMID: 31411026 Free PMC article.
-
Proteus: a random forest classifier to predict disorder-to-order transitioning binding regions in intrinsically disordered proteins.J Comput Aided Mol Des. 2017 May;31(5):453-466. doi: 10.1007/s10822-017-0020-y. Epub 2017 Apr 1. J Comput Aided Mol Des. 2017. PMID: 28365882 Free PMC article.
-
Prediction of Intrinsic Disorder Using Rosetta ResidueDisorder and AlphaFold2.J Phys Chem B. 2022 Oct 27;126(42):8439-8446. doi: 10.1021/acs.jpcb.2c05508. Epub 2022 Oct 17. J Phys Chem B. 2022. PMID: 36251522
-
Functional roles of transiently and intrinsically disordered regions within proteins.FEBS J. 2015 Apr;282(7):1182-9. doi: 10.1111/febs.13202. Epub 2015 Jan 29. FEBS J. 2015. PMID: 25631540 Review.
-
Characterization of intrinsically disordered proteins and their dynamic complexes: From in vitro to cell-like environments.Prog Nucl Magn Reson Spectrosc. 2018 Dec;109:79-100. doi: 10.1016/j.pnmrs.2018.07.001. Epub 2018 Jul 31. Prog Nucl Magn Reson Spectrosc. 2018. PMID: 30527137 Review.
Cited by
-
Predicting substitutions to modulate disorder and stability in coiled-coils.BMC Bioinformatics. 2020 Dec 21;21(Suppl 19):573. doi: 10.1186/s12859-020-03867-x. BMC Bioinformatics. 2020. PMID: 33349244 Free PMC article.
-
Protein shape sampled by ion mobility mass spectrometry consistently improves protein structure prediction.Nat Commun. 2022 Jul 28;13(1):4377. doi: 10.1038/s41467-022-32075-9. Nat Commun. 2022. PMID: 35902583 Free PMC article.
-
Computational Structure Prediction for Antibody-Antigen Complexes From Hydrogen-Deuterium Exchange Mass Spectrometry: Challenges and Outlook.Front Immunol. 2022 May 26;13:859964. doi: 10.3389/fimmu.2022.859964. eCollection 2022. Front Immunol. 2022. PMID: 35720345 Free PMC article. Review.
-
Investigating In Situ Expression of c-MYC and Candidate Ubiquitin-Specific Proteases in DLBCL and Assessment for Peptidyl Disruptor Molecule against c-MYC-USP37 Complex.Molecules. 2023 Mar 7;28(6):2441. doi: 10.3390/molecules28062441. Molecules. 2023. PMID: 36985413 Free PMC article.
-
Predicting ion mobility collision cross sections using projection approximation with ROSIE-PARCS webserver.Brief Bioinform. 2023 Sep 20;24(5):bbad308. doi: 10.1093/bib/bbad308. Brief Bioinform. 2023. PMID: 37609950 Free PMC article.
References
-
- Berman HM, Battistuz T, Bhat TN, Bluhm WF, Bourne PE, Burkhardt K, Feng Z, Gilliland GL, Iype L, Jain S, et al. The Protein Data Bank. Acta Crystallogr D Biol Crystallogr. 2002;58(Pt 6 No 1):899–907. - PubMed
-
- Uversky VN. Introduction to intrinsically disordered proteins (IDPs) Chem Rev. 2014;114(13):6557–6560. - PubMed
Publication types
MeSH terms
Substances
Grants and funding
LinkOut - more resources
Full Text Sources
Other Literature Sources
Research Materials
Miscellaneous

