

Dynamic cerebral autoregulation is preserved during isometric handgrip and head-down tilt in healthy volunteers
- PMID: 29595918
- PMCID: PMC5875546
- DOI: 10.14814/phy2.13656
Dynamic cerebral autoregulation is preserved during isometric handgrip and head-down tilt in healthy volunteers
Abstract
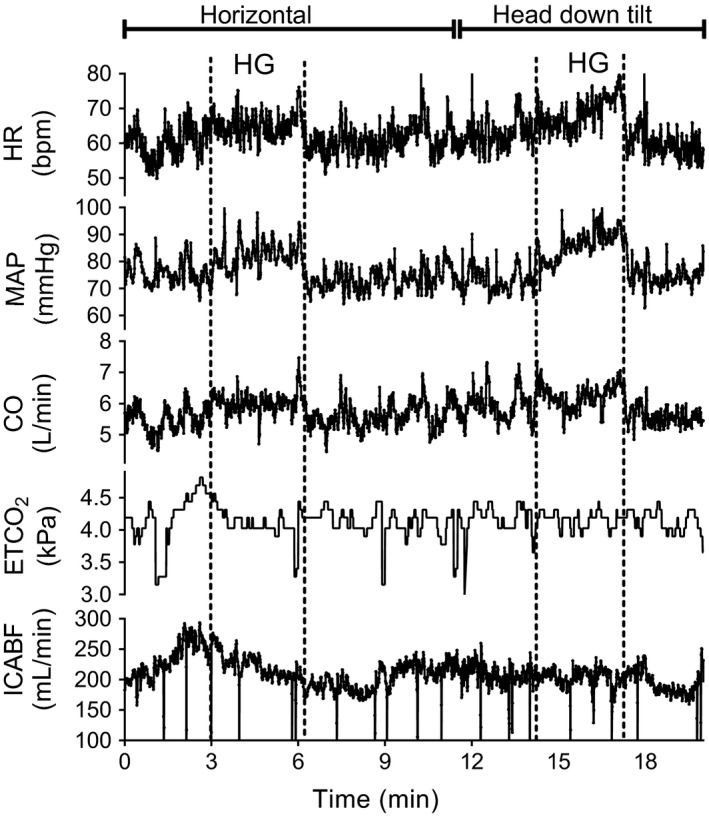
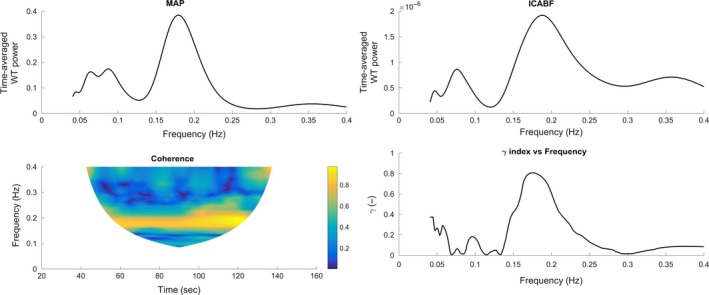
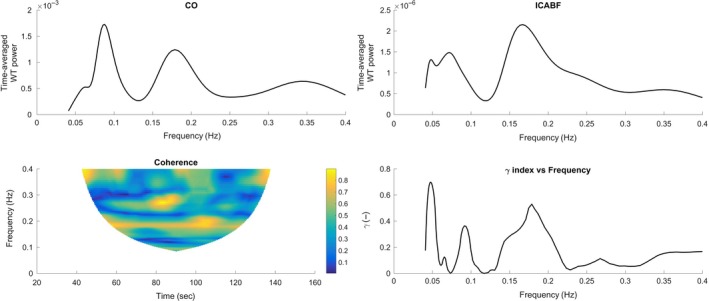
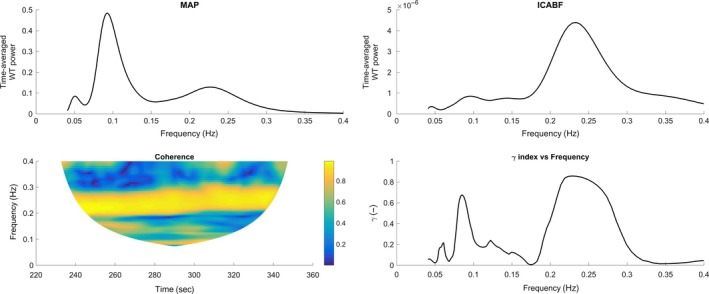
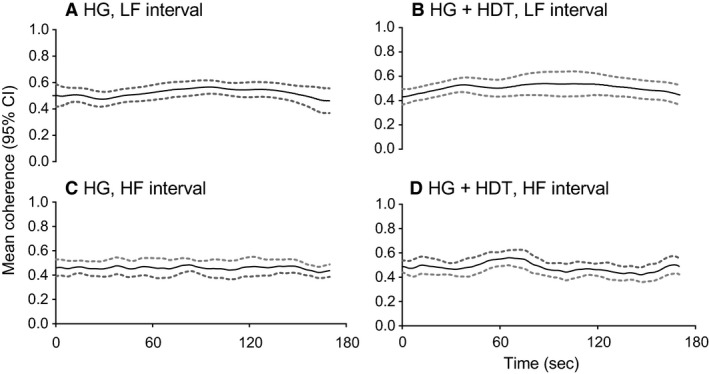
In healthy humans, cerebral blood flow (CBF) is autoregulated against changes in arterial blood pressure. Spontaneous fluctuations in mean arterial pressure (MAP) and CBF can be used to assess cerebral autoregulation. We hypothesized that dynamic cerebral autoregulation is affected by changes in autonomic activity, MAP, and cardiac output (CO) induced by handgrip (HG), head-down tilt (HDT), and their combination. In thirteen healthy volunteers, we recorded blood velocity by ultrasound in the internal carotid artery (ICA), HR, MAP and CO-estimates from continuous finger blood pressure, and end-tidal CO2 . Instantaneous ICA beat volume (ICABV, mL) and ICA blood flow (ICABF, mL/min) were calculated. Wavelet synchronization index γ (0-1) was calculated for the pairs: MAP-ICABF, CO-ICABF and HR-ICABV in the low (0.05-0.15 Hz; LF) and high (0.15-0.4 Hz; HF) frequency bands. ICABF did not change between experimental states. MAP and CO were increased during HG (+16% and +15%, respectively, P < 0.001) and during HDT + HG (+12% and +23%, respectively, P < 0.001). In the LF interval, median γ for the MAP-ICABF pair (baseline: 0.23 [0.12-0.28]) and the CO-ICABF pair (baseline: 0.22 [0.15-0.28]) did not change with HG, HDT, or their combination. High γ was observed for the HR-ICABV pair at the respiratory frequency, the oscillations in these variables being in inverse phase. The unaltered ICABF and the low synchronization between MAP and ICABF in the LF interval suggest intact dynamic cerebral autoregulation during HG, HDT, and their combination.
Keywords: Dynamic cerebral autoregulation; head-down tilt; isometric handgrip; wavelet analysis.
© 2018 The Authors. Physiological Reports published by Wiley Periodicals, Inc. on behalf of The Physiological Society and the American Physiological Society.
Figures
Similar articles
-
Effects of -10° and -30° head-down tilt on cerebral blood velocity, dynamic cerebral autoregulation, and noninvasively estimated intracranial pressure.J Appl Physiol (1985). 2022 Apr 1;132(4):938-946. doi: 10.1152/japplphysiol.00283.2021. Epub 2022 Feb 24. J Appl Physiol (1985). 2022. PMID: 35201934 Free PMC article.
-
Dynamic Cerebral Autoregulation During the Combination of Mild Hypercapnia and Cephalad Fluid Shift.Aerosp Med Hum Perform. 2017 Sep 1;88(9):819-826. doi: 10.3357/AMHP.4870.2017. Aerosp Med Hum Perform. 2017. PMID: 28818140
-
Respiration-related cerebral blood flow variability increases during control-mode non-invasive ventilation in normovolemia and hypovolemia.Eur J Appl Physiol. 2017 Nov;117(11):2237-2249. doi: 10.1007/s00421-017-3711-0. Epub 2017 Sep 12. Eur J Appl Physiol. 2017. PMID: 28900720
-
Cerebral blood flow response to cardiorespiratory oscillations in healthy humans.Auton Neurosci. 2023 Mar;245:103069. doi: 10.1016/j.autneu.2022.103069. Epub 2022 Dec 23. Auton Neurosci. 2023. PMID: 36584666 Review.
-
Impaired cerebral autoregulation: measurement and application to stroke.J Neurol Neurosurg Psychiatry. 2017 Jun;88(6):520-531. doi: 10.1136/jnnp-2016-314385. J Neurol Neurosurg Psychiatry. 2017. PMID: 28536207 Review.
Cited by
-
Dynamic cerebral autoregulation is preserved during orthostasis and intrathoracic pressure regulation in healthy subjects: A pilot study.Physiol Rep. 2024 May;12(9):e16027. doi: 10.14814/phy2.16027. Physiol Rep. 2024. PMID: 38684421 Free PMC article.
-
Effect of head down tilt on heart rate variability.J Family Med Prim Care. 2021 Jan;10(1):439-442. doi: 10.4103/jfmpc.jfmpc_1642_20. Epub 2021 Jan 30. J Family Med Prim Care. 2021. PMID: 34017767 Free PMC article.
-
Effects of Resistance Exercise and Nutritional Supplementation on Dynamic Cerebral Autoregulation in Head-Down Bed Rest.Front Physiol. 2019 Aug 27;10:1114. doi: 10.3389/fphys.2019.01114. eCollection 2019. Front Physiol. 2019. PMID: 31507460 Free PMC article.
References
-
- Aaslid, R. , Lindegaard K. F., Sorteberg W., and Nornes H.. 1989. Cerebral autoregulation dynamics in humans. Stroke 20:45–52. - PubMed
-
- Addison, P. S. 2015. A review of wavelet transform time‐frequency methods for NIRS‐based analysis of cerebral autoregulation. IEEE Rev. Biomed. Eng. 8:78–85. - PubMed
-
- Baden, J. R. , Abrosimova M., Boulet L. M., Tymko M. M., Pfoh J. R., Skow R. J., et al. 2014. Extreme respiratory sinus arrhythmia in response to superimposed head‐down tilt and deep breathing. Aviat. Space Environ. Med. 85:1222–1228. - PubMed
-
- Berens, P. 2009. CircStat: a MATLAB toolbox for circular statistics. J. Stat. Soft. 31:21.
-
- Bogert, L. W. , and van Lieshout J. J.. 2005. Non‐invasive pulsatile arterial pressure and stroke volume changes from the human finger. Exp. Physiol. 90:437–446. - PubMed
Publication types
MeSH terms
LinkOut - more resources
Full Text Sources
Other Literature Sources
Research Materials
Miscellaneous
