. 2018 Oct 1;43(19):E1127-E1134.
doi: 10.1097/BRS.0000000000002657.

Changes in Lumbar Endplate Area and Concavity Associated With Disc Degeneration

Affiliations

Changes in Lumbar Endplate Area and Concavity Associated With Disc Degeneration

Philip K Louie et al. Spine (Phila Pa 1976). .

Abstract

Study design: Retrospective image-based analysis.

Objective: To measure endplate three-dimensional (3D) geometry, endplate changes in vivo and to investigate correlations between disc degeneration and endplate 3D geometry dependent on symptoms of low back pain (LBP).

Summary of background data: It has been hypothesized that alteration of load transmission from the nucleus pulposus to the annulus fibrosus affects vertebral endplate geometry.

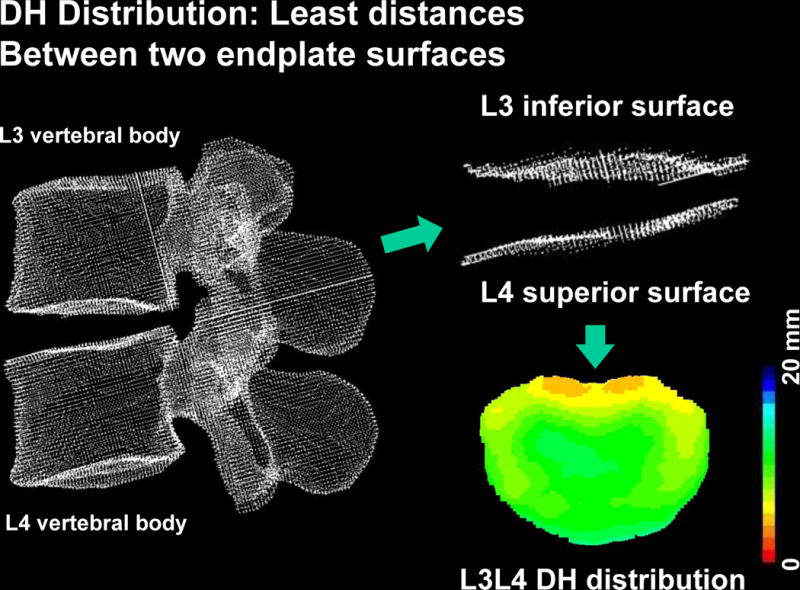
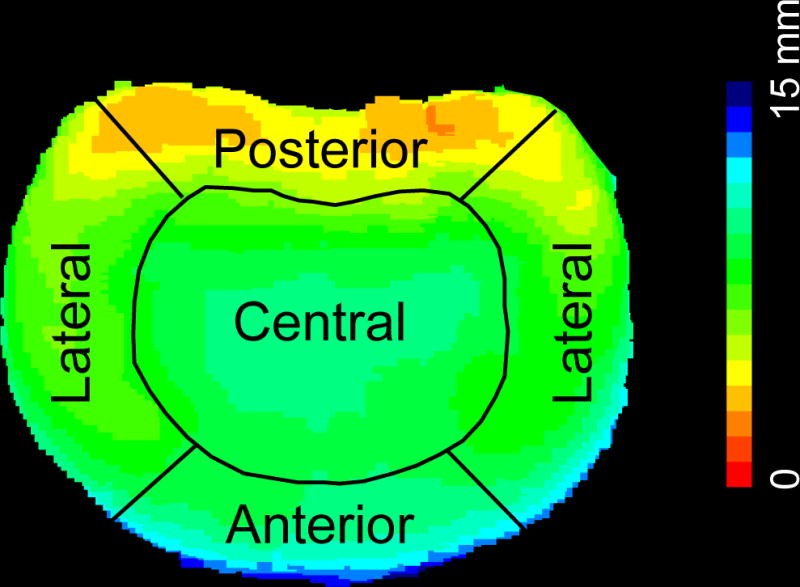
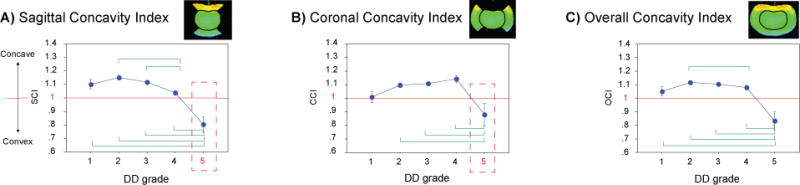
Methods: 3D surface models of inferior/superior lumbar endplates were created from computed tomography scans of n = 92 volunteers with and without LBP. Disc degeneration was evaluated using Pfirrmann scale. Concavity in both coronal and sagittal planes was assessed with the Concavity Index (unitless; larger than 1: concave; flat: 1; and less than 1: convex, respectively). Endplate area and disc height distribution were computed and the effects from demographics and spinal degeneration were sought with an analysis of variance model.

Results: Both sagittal and coronal planes revealed significantly decreased concavity in those with terminal grade 5 disc degeneration (mean 0.833 ± 0.235) compared to the other grades in the cohort. Older subjects presented with larger endplate areas than the younger subjects (P = 0.0148) at L4-S1. Overall, symptomatic subjects had significantly larger endplate areas (P = 0.022), especially at the lower lumbar levels (P < 0.001). Analysis of variance showed that sex, disc level, disc degeneration grade, and disc height reached significance (P < 0.0001) as influential parameters in both Concavity Index cases.

Conclusion: With advancing intervertebral disc degeneration, endplates become more convex over time in both sagittal and coronal planes. Our findings implicate the endplate changes with advancing disc degeneration in the shift in load transmission from the nucleus pulposus to the annulus fibrosus, resulting in changes within the curvature of the endplates. This is also the first study to describe the direct impact of age, sex, and LBP on vertebral endplate anatomy.

Level of evidence: 5.


Figures

Figure 1
Figure 1
Representative data set for a L3/L4 motion segment where the least-distance algorithm performed a search across the entire surface to obtain the disc height distribution. The mean height of each disc was calculated from this data.
Figure 2
Figure 2
Diagram showing the local coordinate system used as a mapping system on the endplate. The origin of the diagonal lines is the centroid of the endplate and the diagonals were set at 45° from the mid-coronal plane. Radial distances cutoff was set at 60% to define the Anterior (A, cyan), Posterior (P, green), Left-lateral (L-Lat, yellow), and Right-lateral (R-lat, red) zones.
Figure 3
Figure 3
Using the convention from Fig. 2, the endplate was divided into five topographic zones. This is a representative image showing the disc height distribution with the colormap scale bar in mm.
Figure 4
Figure 4
Concavity index with disc degeneration based on Pfirrmann Grades. A value of 1 was designated to imply a flat surface. Thus, a value larger than 1 described a concave geometry and a value less than 1 described a convex geometry. The sagittal (A) and coronal (B) endplate geometry was found to become significantly concave in Pfirmann Grade 5 discs compared to those with the other Grades of disc degeneration. The sagittal and coronal plane measurements were combined, revealing similar patterns to those of the sagittal and coronal planes (C). The green lines depict significant differences (P< 0.05) between groups. Abbrevations: SCI, Sagittal Concavity Index; CCI, Coronal Concavity Index, and OCI, Overall Concavity Index, respectively.
Figure 5
Figure 5
Left: There was a trend towards greater total endplate area in males compared to females. Right: When stratified for symptoms of low back pain within each gender, there were differences in both genders, but in reversed fashion: Normal females had larger areas than symptomatic females; and in males the opposite was shown. Abbreviations: M, male; F, female. N, no symptoms; S, Symptomatic for low back pain. Error bars span one standard deviation. Lines above bars show significant differences between groups (*: p< 0.05; **: p < 0.001).
Figure 6
Figure 6
A) Endplate areas were larger in older subjects (ages 40-59) than in younger subjects (ages 20-39) at the lower lumbar levels. B) When evaluating the presence of low back pain symptoms, stratified by age groups, the older group of subjects with symptoms had significantly larger endplate areas than those that denied low back pain symptoms. Overall, symptomatic subjects were shown to have significantly larger endplate areas, especially at the lower lumbar levels (C). Abbreviations: LLS, Lower Lumbo-Sacral (L4-S1); ULS, Upper Lumbar (L1-L3); N, no symptoms; S, Symptomatic for low back pain. Error bars span one standard deviation. Unless noted, lines above experimental groups denote significant differences at p < 0.05.

Similar articles

Cited by

References

    1. Freburger JK, Holmes GM, Agans RP, et al. The rising prevalence of chronic low back pain. Arch Intern Med. 2009;169(3):251–258. doi: 10.1001/archinternmed.2008.543. - DOI - PMC - PubMed
    1. Dagenais S, Caro J, Haldeman S. A systematic review of low back pain cost of illness studies in the United States and internationally. The Spine Journal. 2008;8(1):8–20. doi: 10.1016/j.spinee.2007.10.005. - DOI - PubMed
    1. Vos T, Flaxman AD, Naghavi M, et al. Years lived with disability (YLDs) for 1160 sequelae of 289 diseases and injuries 1990-2010: a systematic analysis for the Global Burden of Disease Study 2010. Lancet. 2012;380(9859):2163–2196. doi: 10.1016/S0140-6736(12)61729-2. - DOI - PMC - PubMed
    1. Mok FPS, Samartzis D, Karppinen J, Fong DYT, Luk KDK, Cheung KMC. Modic changes of the lumbar spine: prevalence, risk factors, and association with disc degeneration and low back pain in a large-scale population-based cohort. Spine J. 2016;16(1):32–41. doi: 10.1016/j.spinee.2015.09.060. - DOI - PubMed
    1. White AA, III, Panjabi MM. Clinical Biomechanics of the Spine. 2nd. Philadelphia: Lippincott; 1990.