Clinical Trial
. 2018 Mar 29;10(4):428.
doi: 10.3390/nu10040428.

Optimal Serum Ferritin Levels for Iron Deficiency Anemia during Oral Iron Therapy (OIT) in Japanese Hemodialysis Patients with Minor Inflammation and Benefit of Intravenous Iron Therapy for OIT-Nonresponders

Affiliations
Clinical Trial

Optimal Serum Ferritin Levels for Iron Deficiency Anemia during Oral Iron Therapy (OIT) in Japanese Hemodialysis Patients with Minor Inflammation and Benefit of Intravenous Iron Therapy for OIT-Nonresponders

Kazuya Takasawa et al. Nutrients. .

Abstract

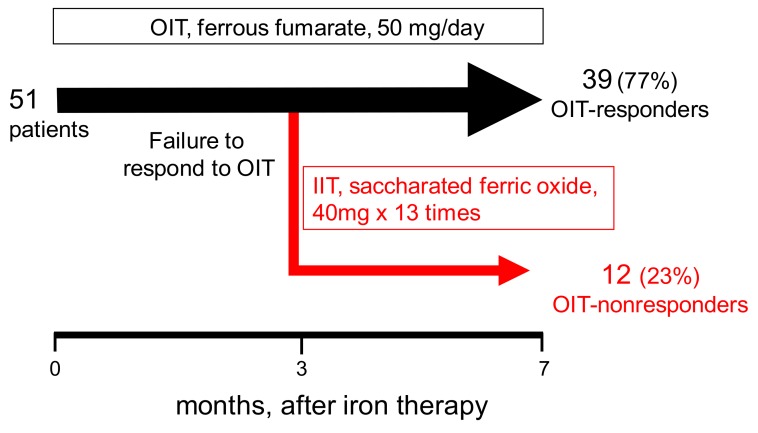
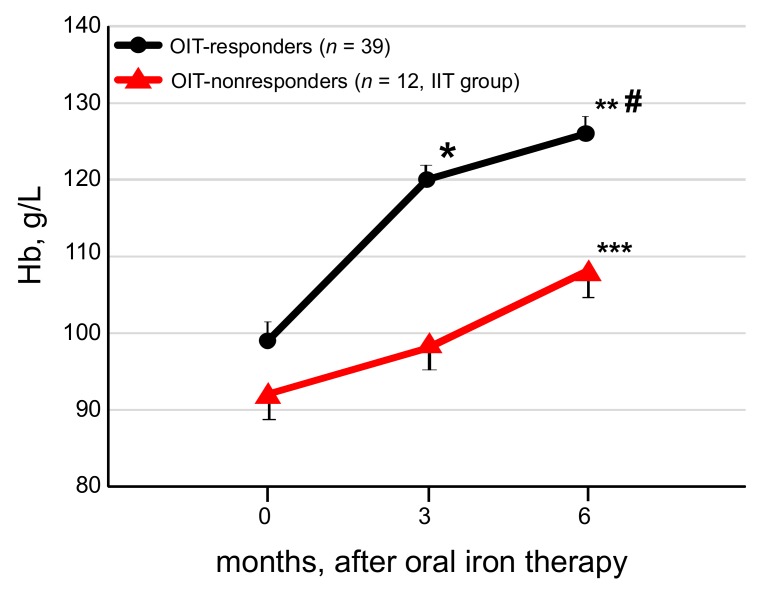
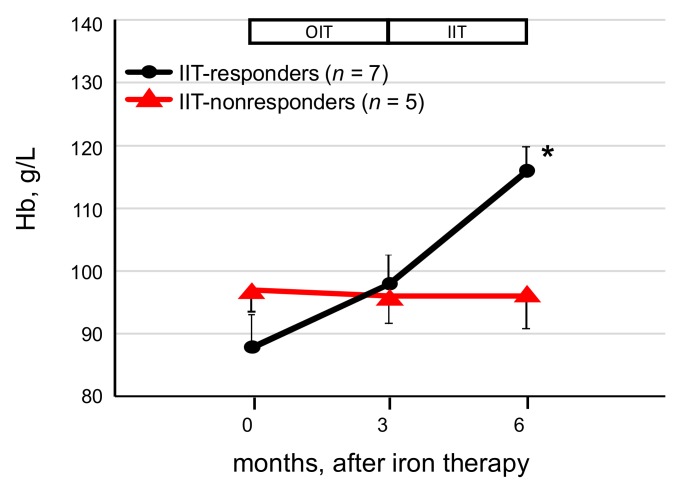
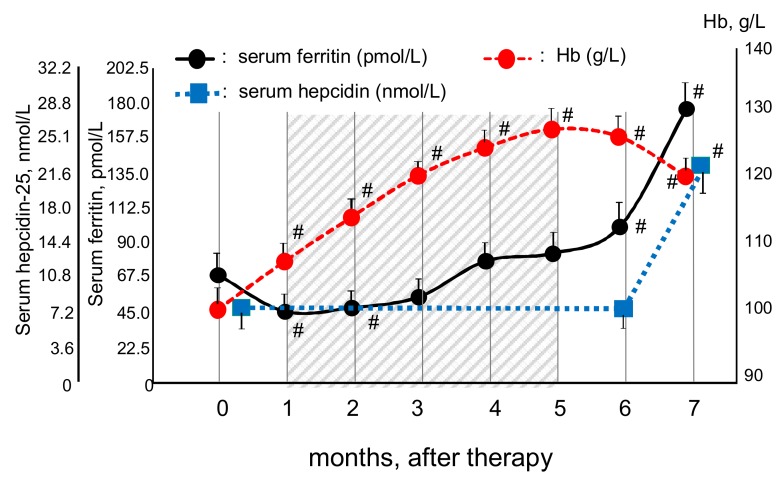
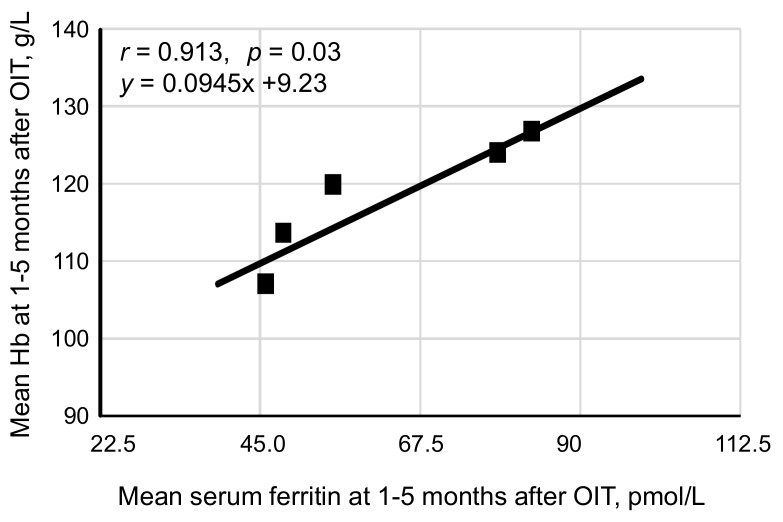
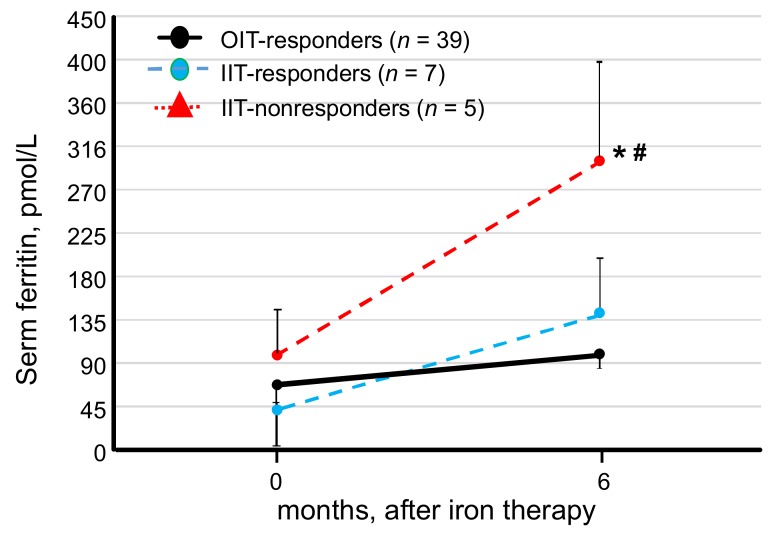
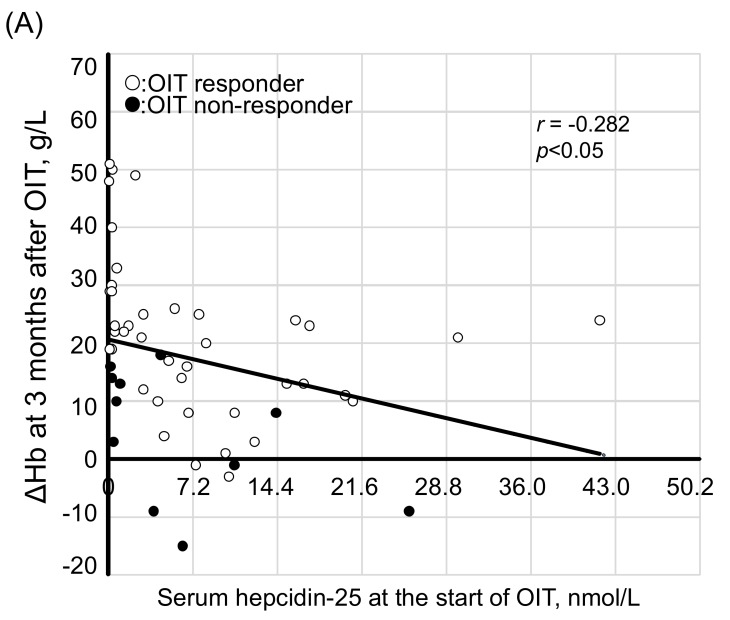
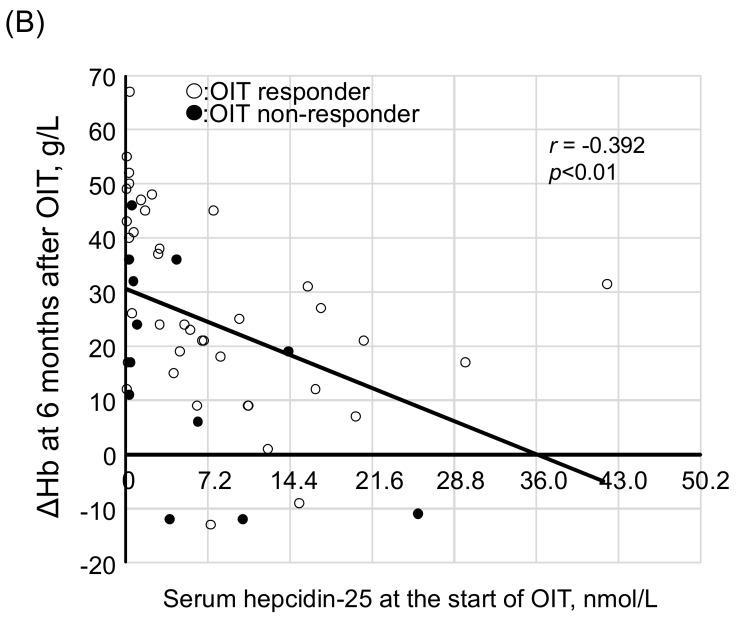
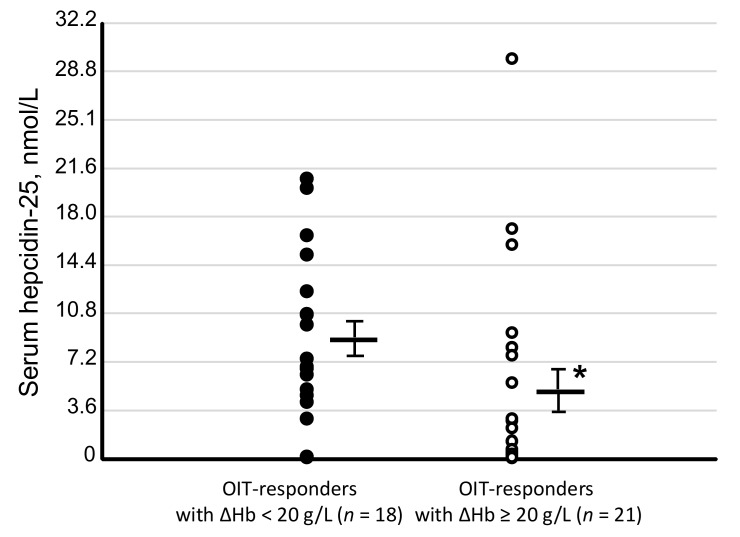
Background: We determined optimal serum ferritin for oral iron therapy (OIT) in hemodialysis (HD) patients with iron deficiency anemia (IDA)/minor inflammation, and benefit of intravenous iron therapy (IIT) for OIT-nonresponders. Methods: Inclusion criteria were IDA (Hb <120 g/L, serum ferritin <227.4 pmol/L). Exclusion criteria were inflammation (C-reactive protein (CRP) ≥ 5 mg/L), bleeding, or cancer. IIT was withheld >3 months before the study. ΔHb ≥ 20 g/L above baseline or maintaining target Hb (tHB; 120-130 g/L) was considered responsive. Fifty-one patients received OIT (ferrous fumarate, 50 mg/day) for 3 months; this continued in OIT-responders but was switched to IIT (saccharated ferric oxide, 40 mg/week) in OIT-nonresponders for 4 months. All received continuous erythropoietin receptor activator (CERA). Hb, ferritin, hepcidin-25, and CERA dose were measured. Results: Demographics before OIT were similar between OIT-responders and OIT-nonresponders except low Hb and high triglycerides in OIT-nonresponders. Thirty-nine were OIT-responders with reduced CERA dose. Hb rose with a peak at 5 months. Ferritin and hepcidin-25 continuously increased. Hb positively correlated with ferritin in OIT-responders (r = 0.913, p = 0.03) till 5 months after OIT. The correlation equation estimated optimal ferritin of 30-40 ng/mL using tHb (120-130 g/L). Seven OIT-nonresponders were IIT-responders. Conclusions: Optimal serum ferritin for OIT is 67.4-89.9 pmol/L in HD patients with IDA/minor inflammation. IIT may be a second line of treatment for OIT-nonreponders.

Keywords: ferritin; hemodialysis; hepcidin-25; inflammation; iron deficiency anemia; oral iron therapy.


Conflict of interest statement

The authors declare no conflict of interest.

Figures

Figure 1
Figure 1
Protocol of iron therapy. Fifty-one consecutive hemodialysis (HD) patients with iron deficiency anemia (IDA) and minor inflammation were first treated with oral ferrous fumarate (50 mg/day). At 3 months after oral iron therapy (OIT), the patients were classified into two groups; OIT-responders and OIT-nonresponders. OIT was continued in 39 OIT-responders for another 4 months. OIT was switched to intravenous iron therapy (IIT; saccharated ferric oxide: 40 mg × 13 times for another 4 months) in the remaining 12 OIT-nonresponders. All patients simultaneously received a continuous erythropoietin receptor activator (CERA) during the study period.
Figure 2
Figure 2
Change of Hb levels in OIT-responders and OIT-nonresponders. The Hb levels were increased at 3 and 6 months after OIT in OIT-responders. In OIT-nonresponders, the Hb levels remained unchanged at 3 months after OIT but increased with IIT at the end of the study as a whole IIT-group. Data are expressed as mean ± standard error of the mean (SEM). Comparison of two nonparametric data groups was analyzed by the Mann-Whitney U test. * p < 0.01, vs. data at 0 month, ** p < 0.01, vs. data at 3 months, *** p < 0.05, vs. data at 3 months, # p < 0.05, vs. OIT-nonresponders.
Figure 3
Figure 3
Change of Hb levels in IIT group before and after IIT. Of the 12 OIT-nonresponders, the levels of Hb were significantly increased in seven (58.3%) of the 12 patients at the end of the study, whereas the Hb levels remained unchanged in the five IIT-nonresponders. Data are expressed as mean ± SEM. Comparison of two nonparametric data groups was analyzed by the Mann–Whitney U test. * p < 0.01, vs. IIT-nonresponders.
Figure 4
Figure 4
Sequential change in the levels of Hb, serum ferritin and hepcidin-25 in OIT-responders during OIT. The levels of Hb rose linearly with a peak at 5 months after OIT and then slightly decreased at the end of the study. Serum levels of ferritin were decreased from baseline at 1 month, and then rose continuously from 2 to 7 months after OIT. Serum levels of hepcidin-25 were similar to baseline at 6 months but significantly increased at the end of the study. Serum levels of hepcidin-25 were positively correlated with those of ferritin in the OIT-responders (r = 0.869, p = 0.0002). Data are expressed as mean ± SEM. Comparison of 2 means was determined by the Man–Whitney U test. # p < 0.01, vs. data at 0 month.
Figure 5
Figure 5
Correlation of Hb and serum ferritin between 1 and 5 months after OIT in OIT-responders. Ccorrelation between the levels of Hb and serum ferritin was analyzed in 39 OIT-responders using mean values for Hb and serum ferritin at every month obtained from OIT-responders as a whole. The levels of Hb were positively correlated with serum levels of ferritin till 5 months after OIT in 39 OIT-responders. The correlation equation calculated by Pearson’s correlation coefficient test was y = 0.0945x + 9.23, where y = Hb: x = serum ferritin.
Figure 6
Figure 6
Change in serum levels of ferritin at 0 and 6 months after initiation of the study in OIT-responders, IIT-responders and IIT-nonresponders. Serum levels of ferritin were significantly higher in the IIT-nonresponders than in the OIT-responders and the IIT-responders, whereas there was no difference in serum ferritin levels between the OIT-responders and the IIT-responders. Comparison of three nonparametric data groups was analyzed by the Tukey–Kramer test. * p < 0.05, vs. IIT-responders, # p < 0.01, vs. OIT-responders.
Figure 7
Figure 7
Correlation between serum levels of hepcidin-25 at the start of OIT and ΔHb at 3 and 6 months after OIT. Serum levels of hepcidin-25 at the start of OIT were negatively correlated with ΔHb at 3 months (r = −0.282, p < 0.05) (A) and at 6 months (r = −0.392, p < 0.01) (B) in 51 HD patients. The correlation equation was calculated by Pearson’s correlation coefficient test. White circle: OIT-responders, black circle: OIT-nonreponders.
Figure 7
Figure 7
Correlation between serum levels of hepcidin-25 at the start of OIT and ΔHb at 3 and 6 months after OIT. Serum levels of hepcidin-25 at the start of OIT were negatively correlated with ΔHb at 3 months (r = −0.282, p < 0.05) (A) and at 6 months (r = −0.392, p < 0.01) (B) in 51 HD patients. The correlation equation was calculated by Pearson’s correlation coefficient test. White circle: OIT-responders, black circle: OIT-nonreponders.
Figure 8
Figure 8
Serum levels of hepcidin-25 at the start of OIT between 21 OIT-responders with ΔHb ≥ 20 g/L and 18 OIT-responders achieving target Hb but ΔHb < 20 g/L at 3 months after OIT. Serum levels of hepcidin-25 at the start of OIT were significantly lower in the 21 OIT-responders with ΔHb ≥ 20 g/L than those in the 18 OIT responders who achieved target Hb (120–130 g/L) but ΔHb < 20 g/L. Comparison of two nonparametric data groups was analyzed by the Mann–Whitney U test. White circle: OIT-responders with ΔHb ≥ 20 g/L, black circle: the 18 OIT-responders with ΔHb < 20 g/L. * p < 0.05 vs. OIT-responders with ΔHb < 20 g/L.

Similar articles

Cited by

References

    1. Vaziri N.D. Safety issues in iron treatment in CKD. Semin. Nephrol. 2016;36:112–118. doi: 10.1016/j.semnephrol.2016.02.005. - DOI - PubMed
    1. Lopez A., Cacoub P., Macdougall I.C., Peyrin-Biroulet L. Iron deficiency anaemia. Lancet. 2016;387:907–916. doi: 10.1016/S0140-6736(15)60865-0. - DOI - PubMed
    1. The Kidney Disease: Improving Global Outcomes (KDIGO) Anemia Work Group KDIGO clinical practice guideline for anemia in chronic kidney disease. Kidney Int. Suppl. 2012;2:279–335.
    1. Macdougall I.C., Bock A.H., Carrera F., Eckardt K.U., Gaillard C., Van Wyck D., Roubert B., Nolen J.G., Roger S.D., FIND-CKD Study Investigators FIND-CKD: A randomized trial of intravenous ferric carboxymaltose versus oral iron in patients with chronic kidney disease and iron deficiency anaemia. Nephrol. Dial. Transplant. 2014;29:2075–2084. doi: 10.1093/ndt/gfu201. - DOI - PMC - PubMed
    1. Tsubakihara Y., Nishi S., Akiba T., Hirakata H., Iseki K., Kubota M., Kuriyama S., Komatsu Y., Suzuki M., Nakai S., et al. 2008 Japanese Society for Dialysis Therapy: Guidelines for renal anemia in chronic kidney disease. Ther. Apher. Dial. 2010;14:240–275. doi: 10.1111/j.1744-9987.2010.00836.x. - DOI - PubMed

Publication types

MeSH terms