Resveratrol Suppresses the Growth and Enhances Retinoic Acid Sensitivity of Anaplastic Thyroid Cancer Cells
- PMID: 29596381
- PMCID: PMC5979404
- DOI: 10.3390/ijms19041030
Resveratrol Suppresses the Growth and Enhances Retinoic Acid Sensitivity of Anaplastic Thyroid Cancer Cells
Abstract
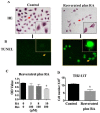
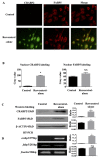
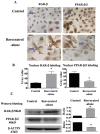
Anaplastic thyroid cancer (ATC) is a highly lethal undifferentiated malignancy without reliable therapies. Retinoic acid (RA) has been employed to promote redifferentiation of thyroid cancers by increasing their I131 uptake and radio-sensitivity, but its effect(s) on ATCs has not yet been ascertained. Likewise, resveratrol induces cancer redifferentiation but, also in this case, its effects on ATCs remain unknown. These issues have been addresses in the current study using three human ATC cell lines (THJ-11T, THJ-16T, and THJ-21T) through multiple experimental approaches. The results reveal that RA exerts a small inhibitory effect on these cell lines. In comparison with normally cultured cells, the total cell number in resveratrol-treated THJ-16T and THJ-21T cultures significantly decreased (p < 0.05), and this effect was accompanied by reduced Cyclin D1 immuno-labeling, increased apoptotic fractions, and distinct caspase-3 activation. Resveratrol failed to inhibit growth but enhanced RA sensitivity of THJ-11T cells, suppressed peroxisome proliferator-activated receptor-β/δ (PPAR-β/δ), and upregulated cellular retinoic acid-binding protein 2 (CRABP2) and retinoic acid receptor beta (RAR-β) expression. Increased thyroglobulin (Tg) and E-cadherin levels and appearance of membranous E-cadherin were evidenced in resveratrol-treated THJ-11T cells. Our results demonstrate for the first time: (1) the therapeutic value of resveratrol by itself or in combination with RA in the management of ATCs, (2) the capacity of resveratrol to overcome RA resistance in ATC cells by reprogramming CRABP2/RAR- and fatty acid-binding protein 5 (FABP5)/PPAR-β/δ-mediated RA signaling, and (3) the redifferentiating potential of resveratrol in ATC cells.
Keywords: CRABP2; anaplastic thyroid cancer; drug resistance; resveratrol; retinoic acid.
Conflict of interest statement
The authors declare no conflict of interest.
Figures

 , apoptosis peak;
  , G1 phase;
  , S phase;
  , G2 phase.
 , apoptosis peak;
  , G1 phase;
  , S phase;
  , G2 phase.
 , apoptosis peak;
  , G1 phase;
  , S phase;
  , G2 phase.
 , apoptosis peak;
  , G1 phase;
  , S phase;
  , G2 phase.


Similar articles
-
STAT3 signaling statuses determine the fate of resveratrol-treated anaplastic thyroid cancer cells.Cancer Biomark. 2020;27(4):461-469. doi: 10.3233/CBM-191010. Cancer Biomark. 2020. PMID: 31958078
-
Dual Inhibition of BRAF-MAPK and STAT3 Signaling Pathways in Resveratrol-Suppressed Anaplastic Thyroid Cancer Cells with BRAF Mutations.Int J Mol Sci. 2022 Nov 19;23(22):14385. doi: 10.3390/ijms232214385. Int J Mol Sci. 2022. PMID: 36430869 Free PMC article.
-
Resveratrol and its Nanoparticle suppress Doxorubicin/Docetaxel-resistant anaplastic Thyroid Cancer Cells in vitro and in vivo.Nanotheranostics. 2021 Jan 1;5(2):143-154. doi: 10.7150/ntno.53844. eCollection 2021. Nanotheranostics. 2021. PMID: 33457193 Free PMC article.
-
Non-classical Transcriptional Activity of Retinoic Acid.Subcell Biochem. 2016;81:179-199. doi: 10.1007/978-94-024-0945-1_7. Subcell Biochem. 2016. PMID: 27830505 Review.
-
Targeting lipid metabolism for the treatment of anaplastic thyroid carcinoma.Expert Opin Ther Targets. 2016;20(2):159-66. doi: 10.1517/14728222.2016.1086341. Epub 2015 Sep 28. Expert Opin Ther Targets. 2016. PMID: 26414044 Free PMC article. Review.
Cited by
-
Resveratrol Reverses Retinoic Acid Resistance of Anaplastic Thyroid Cancer Cells via Demethylating CRABP2 Gene.Front Endocrinol (Lausanne). 2019 Oct 29;10:734. doi: 10.3389/fendo.2019.00734. eCollection 2019. Front Endocrinol (Lausanne). 2019. PMID: 31736873 Free PMC article.
-
Melatonin promotes apoptosis of thyroid cancer cells via regulating the signaling of microRNA-21 (miR-21) and microRNA-30e (miR-30e).Bioengineered. 2022 Apr;13(4):9588-9601. doi: 10.1080/21655979.2022.2054206. Bioengineered. 2022. PMID: 35412442 Free PMC article.
-
Potential Therapeutic Targets of Resveratrol, a Plant Polyphenol, and Its Role in the Therapy of Various Types of Cancer.Molecules. 2022 Apr 21;27(9):2665. doi: 10.3390/molecules27092665. Molecules. 2022. PMID: 35566016 Free PMC article. Review.
-
Synergistic Effects of Resveratrol and Temozolomide Against Glioblastoma Cells: Underlying Mechanism and Therapeutic Implications.Cancer Manag Res. 2020 Sep 11;12:8341-8354. doi: 10.2147/CMAR.S258584. eCollection 2020. Cancer Manag Res. 2020. PMID: 32982428 Free PMC article.
-
Research progress of plant-derived natural products in thyroid carcinoma.Front Chem. 2024 Jan 10;11:1279384. doi: 10.3389/fchem.2023.1279384. eCollection 2023. Front Chem. 2024. PMID: 38268761 Free PMC article. Review.
References
-
- Molinaro E., Romei C., Biagini A., Sabini E., Agate L., Mazzeo S., Materazzi G., Sellari-Franceschini S., Ribechini A., Torregrossa L., et al. Anaplastic thyroid carcinoma: From clinicopathology to genetics and advanced therapies. Nat. Rev. Endocrinol. 2017;13:644–660. doi: 10.1038/nrendo.2017.76. - DOI - PubMed
MeSH terms
Substances
LinkOut - more resources
Full Text Sources
Other Literature Sources
Medical
Research Materials
Miscellaneous

