. 2018 Mar 29;19(4):1034.
doi: 10.3390/ijms19041034.

The Role of Serotonin during Skin Healing in Post-Thermal Injury

Affiliations

The Role of Serotonin during Skin Healing in Post-Thermal Injury

Alia Sadiq et al. Int J Mol Sci. .

Abstract

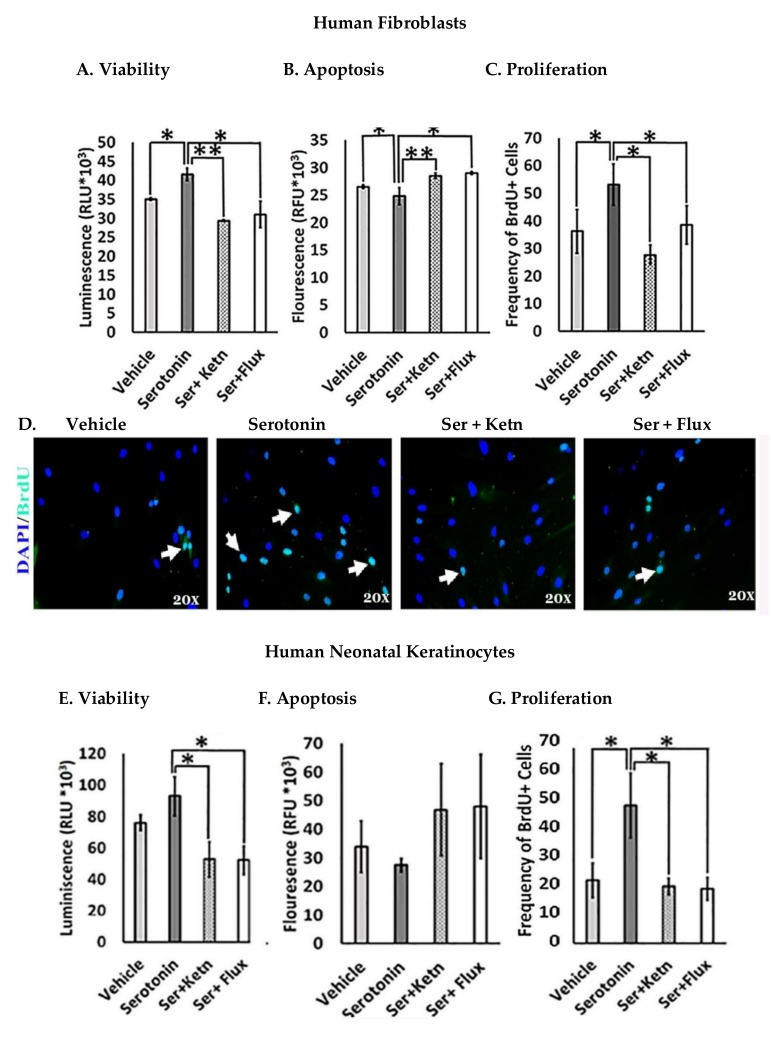
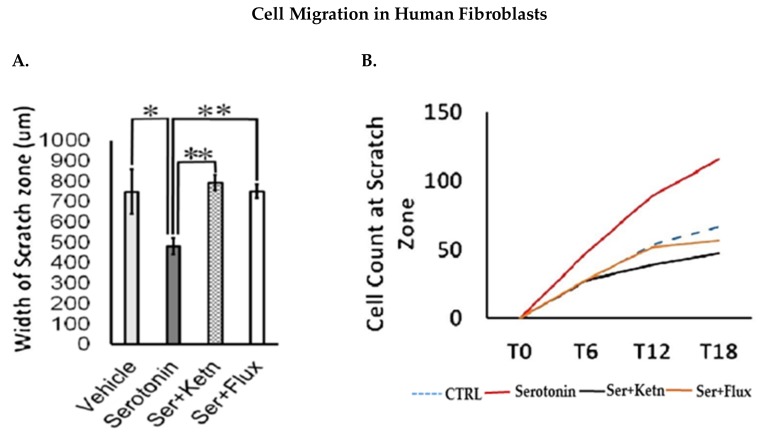
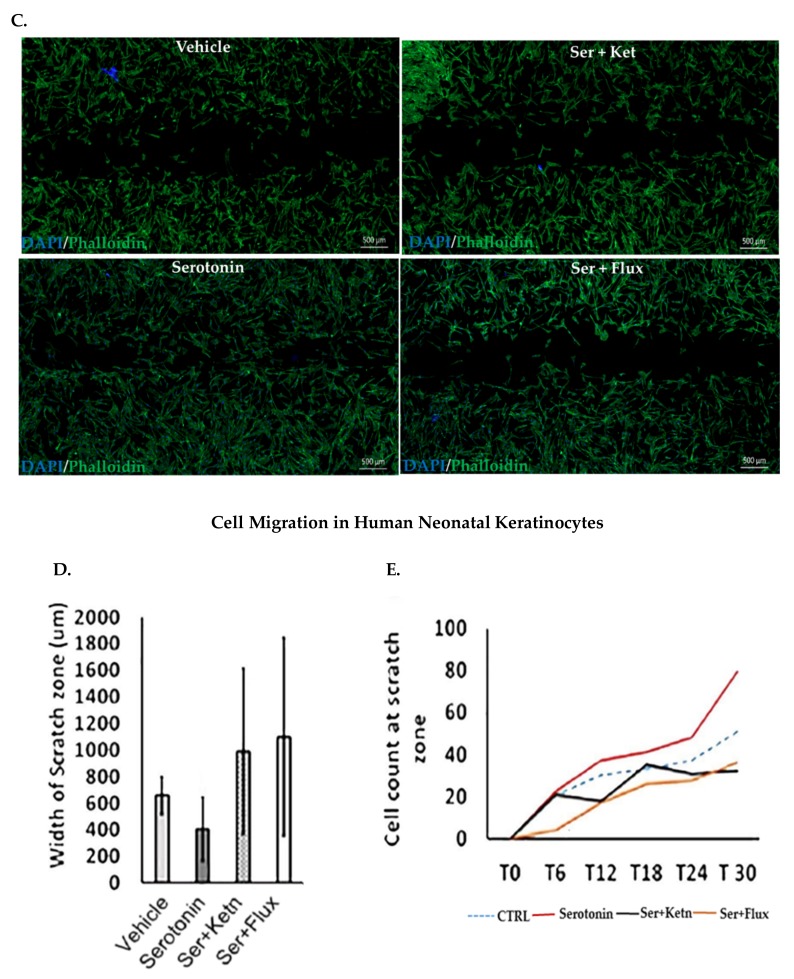
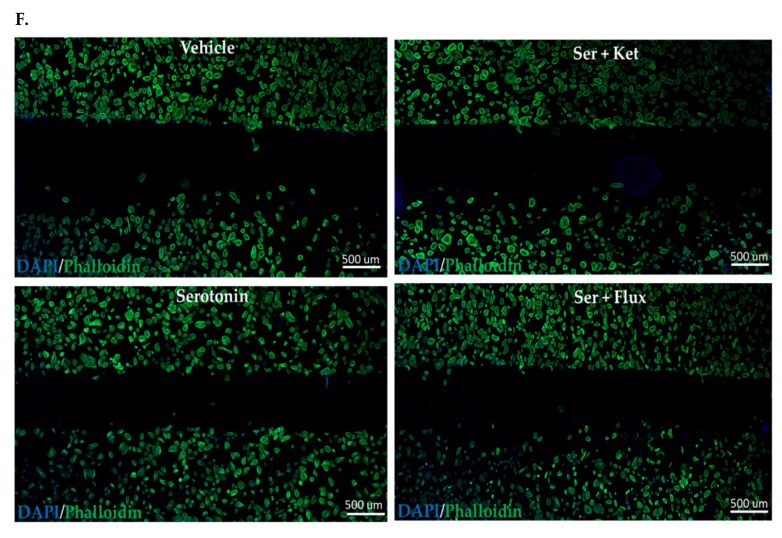
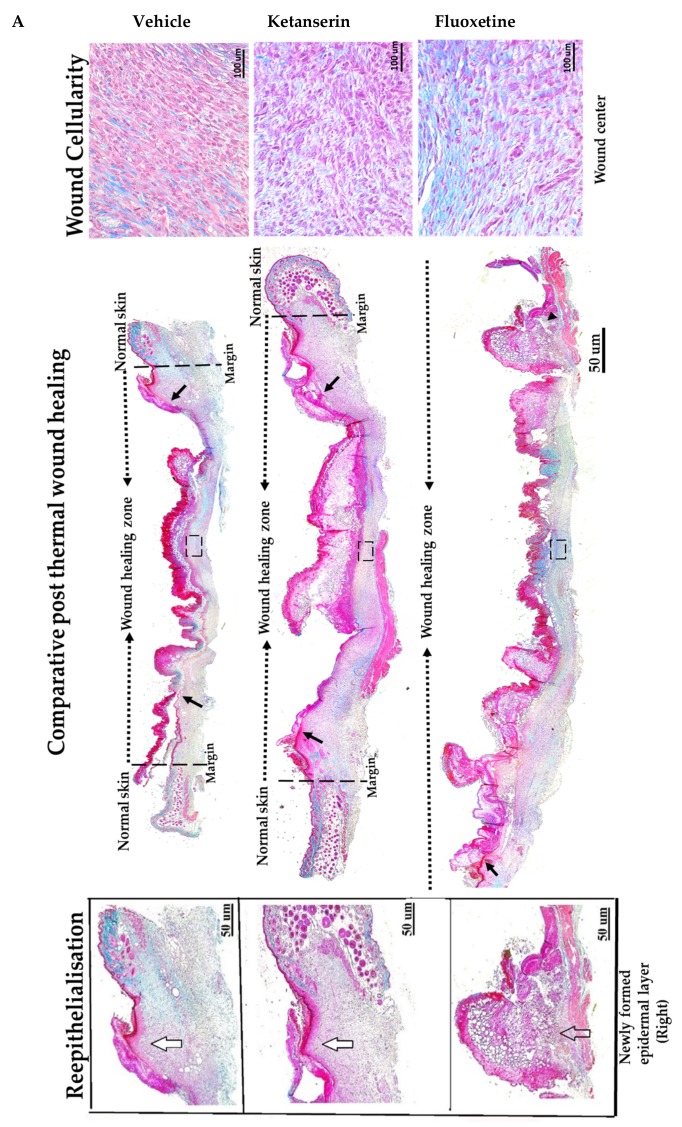
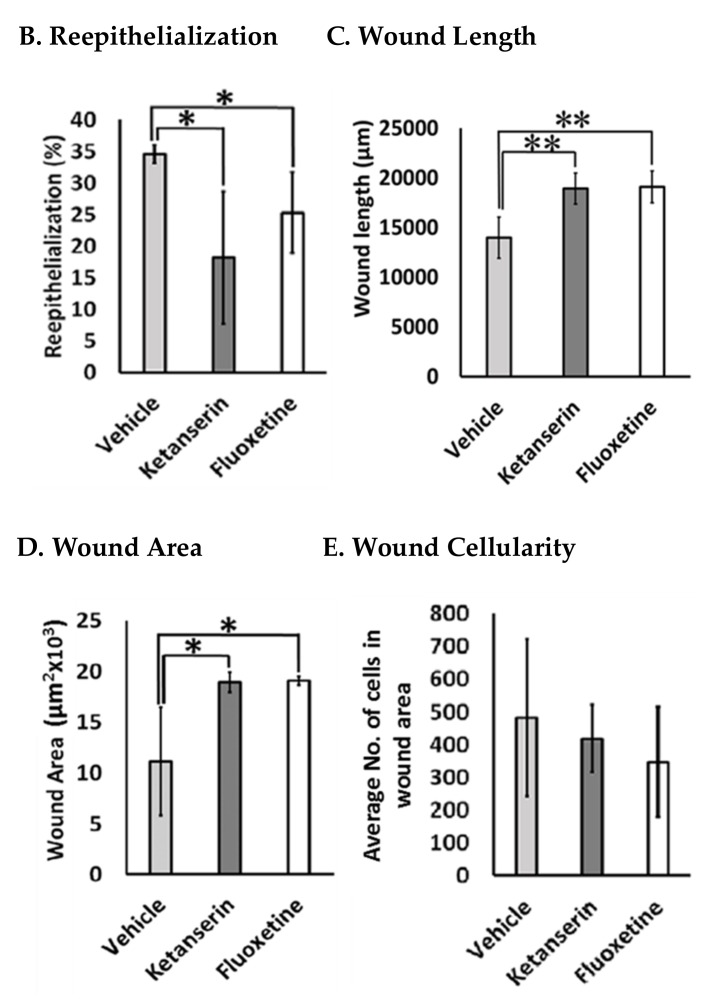
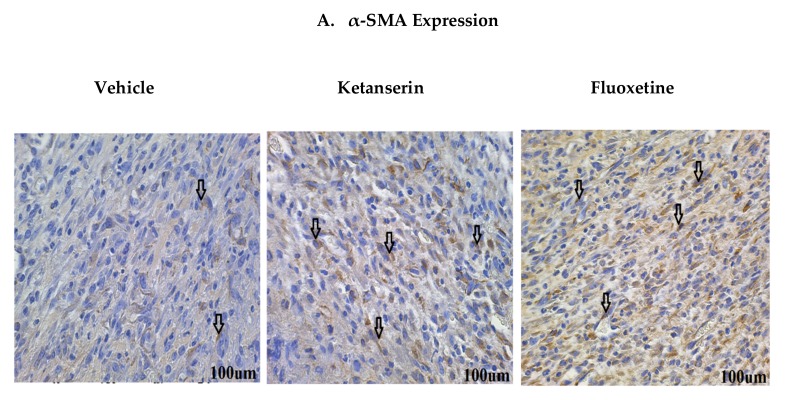
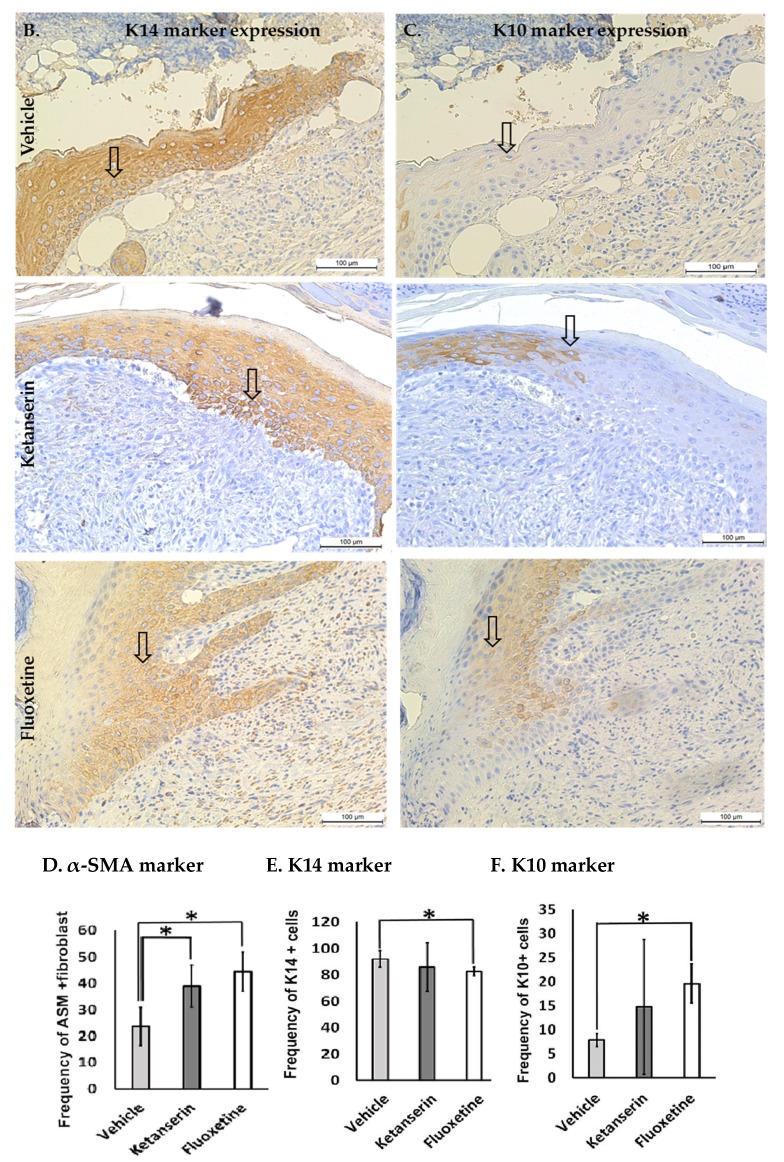
Post-burn trauma significantly raises tissue serotonin concentration at the initial stages of injury, which leads us to investigate its possible role in post burn wound healing. Therefore, we planned this study to examine the role of serotonin in wound healing through in vitro and in vivo models of burn injuries. Results from in vitro analysis revealed that serotonin decreased apoptosis and increased cell survival significantly in human fibroblasts and neonatal keratinocytes. Cellular proliferation also increased significantly in both cell types. Moreover, serotonin stimulation significantly accelerated the cell migration, resulting in narrowing of the scratch zone in human neonatal keratinocytes and fibroblasts cultures. Whereas, fluoxetine (a selective serotonin reuptake inhibitor) and ketanserin (serotonin receptor 2A inhibitor) reversed these effects. Scald burn mice model (20% total body surface area) showed that endogenous serotonin improved wound healing process in control group, whereas fluoxetine and ketanserin treatments (disruptors of endogenous serotonin stimulation), resulted in poor reepithelization, bigger wound size and high alpha smooth muscle actin (α-SMA) count. All of these signs refer a prolonged differentiation state, which ultimately exhibits poor wound healing outcomes. Collectively, data showed that the endogenous serotonin pathway contributes to regulating the skin wound healing process. Hence, the results of this study signify the importance of serotonin as a potential therapeutic candidate for enhancing skin healing in burn patients.

Keywords: fibroblasts; keratinocytes; migration; post thermal injury; serotonin; wound healing.


Conflict of interest statement

The authors declare no conflict of interest.

Figures

Figure 1
Figure 1
Comparative cellular effects of serotonin, ketanserin and fluoxetine drug treatments on (A,E) cell viability (B,F) apoptosis and (C,G) proliferation of human fibroblasts and neonatal keratinocytes cultures, respectively. (D,H) Immunofluorescent staining with anti-BrdU antibody (green) and 4, 6-diamidino-2 phenylindole (DAPI) nuclear stain (blue) in human fibroblasts and neonatal keratinocytes, respectively. White arrows marked BrdU + ve cells. Images scale; 20× resolution. Results were presented as mean ± Standard Deviation (SD), (* p < 0.05, ** p < 0.01), n = 5.
Figure 1
Figure 1
Comparative cellular effects of serotonin, ketanserin and fluoxetine drug treatments on (A,E) cell viability (B,F) apoptosis and (C,G) proliferation of human fibroblasts and neonatal keratinocytes cultures, respectively. (D,H) Immunofluorescent staining with anti-BrdU antibody (green) and 4, 6-diamidino-2 phenylindole (DAPI) nuclear stain (blue) in human fibroblasts and neonatal keratinocytes, respectively. White arrows marked BrdU + ve cells. Images scale; 20× resolution. Results were presented as mean ± Standard Deviation (SD), (* p < 0.05, ** p < 0.01), n = 5.
Figure 2
Figure 2
Comparative cellular effects of serotonin, ketanserin and fluoxetine drug treatments on cell migration, in human fibroblasts and neonatal keratinocytes cultures. (A) Migrating fibroblasts narrowed the scratch zone and width of scratch zone was measured in micrometers (μm) at Time 18 h. (B) Migrated fibroblast’s count in scratch zone from Time 0 h. to Time 18 h. (D) Migrating keratinocytes decreased the scratch width and measured in micrometers (μm) at Time 30 h. (E) Migrated keratinocyte’s count in the scratch zone from Time 0 h to Time 30 h. (C,F) Migration assay: immunofluorescence staining with DAPI and Phalloidin. The scale bar shown in micrometers (μm) at the bottom of each image. Graphical results were presented as mean ± Standard Deviation (SD), (* p < 0.05, ** p < 0.01), n = 5.
Figure 2
Figure 2
Comparative cellular effects of serotonin, ketanserin and fluoxetine drug treatments on cell migration, in human fibroblasts and neonatal keratinocytes cultures. (A) Migrating fibroblasts narrowed the scratch zone and width of scratch zone was measured in micrometers (μm) at Time 18 h. (B) Migrated fibroblast’s count in scratch zone from Time 0 h. to Time 18 h. (D) Migrating keratinocytes decreased the scratch width and measured in micrometers (μm) at Time 30 h. (E) Migrated keratinocyte’s count in the scratch zone from Time 0 h to Time 30 h. (C,F) Migration assay: immunofluorescence staining with DAPI and Phalloidin. The scale bar shown in micrometers (μm) at the bottom of each image. Graphical results were presented as mean ± Standard Deviation (SD), (* p < 0.05, ** p < 0.01), n = 5.
Figure 3
Figure 3
Comparative post thermal skin wound healing in vehicle, ketanserin, and fluoxetine treated groups. (A) Masson’s trichrome staining of two weeks’ post burned skin wound cross-sections (image center). Burn wound area characterized with reddish scab (present over wound), distinguishes it from normal skin. Epidermis stained in red and dermal collagen fibers are stained in blue. Reepithelialization: wound images show new epidermal edge (marked with black arrows), formed over left and right wound margins (dotted black line), and progressing towards the wound center (dotted black arrow head line). Image scale: 50 μm. New epidermal layer zoomed at right margins (white arrows mark the newly formed thick layer of epidermis and transparent arrow indicate poorly formed epidermis) (image left). Wound dermal area characterized with granulation tissue. Images show wound cellularity at wound dermal region (dotted black box showed selected area from each image) (image right). Image scale: 100 μm. (B) Graphical results show comparative reepithelialization (%), (C) wound length (μm) (D) wound area (μm2 × 103) and (E) wound cellularity (average number of cells in wound healing zone) among treatments after two weeks’ post thermal injury. Results were presented as mean ± Standard Deviation (SD), (* p < 0.05, ** p < 0.01), n = 5.
Figure 3
Figure 3
Comparative post thermal skin wound healing in vehicle, ketanserin, and fluoxetine treated groups. (A) Masson’s trichrome staining of two weeks’ post burned skin wound cross-sections (image center). Burn wound area characterized with reddish scab (present over wound), distinguishes it from normal skin. Epidermis stained in red and dermal collagen fibers are stained in blue. Reepithelialization: wound images show new epidermal edge (marked with black arrows), formed over left and right wound margins (dotted black line), and progressing towards the wound center (dotted black arrow head line). Image scale: 50 μm. New epidermal layer zoomed at right margins (white arrows mark the newly formed thick layer of epidermis and transparent arrow indicate poorly formed epidermis) (image left). Wound dermal area characterized with granulation tissue. Images show wound cellularity at wound dermal region (dotted black box showed selected area from each image) (image right). Image scale: 100 μm. (B) Graphical results show comparative reepithelialization (%), (C) wound length (μm) (D) wound area (μm2 × 103) and (E) wound cellularity (average number of cells in wound healing zone) among treatments after two weeks’ post thermal injury. Results were presented as mean ± Standard Deviation (SD), (* p < 0.05, ** p < 0.01), n = 5.
Figure 4
Figure 4
Comparative expression of dermal myofibroblasts alpha smooth muscle actin (α-SMA), epidermal K14 and K10 markers during skin wound healing in vehicle, ketanserin and fluoxetine treatment groups. Two weeks post thermal skin wound sections were harvested and immunostained for these markers. (A) Expression of α-SMA in wound dermal fibroblasts (arrow indicate α-SMA + ve cells); (B) Expression of K14 and (C) K10 in newly formed epidermal layers over the wound area (arrow indicate K14 and K10 + ve keratinocytes in separate images). Image scale bar: 100 μm. Graphical results show comparative (D) α-SMA (E) K14 and (F) K10 expression among treatments after two weeks’ post thermal injury. Results were presented as mean ± Standard Deviation (SD), (* p < 0.05), n = 5.
Figure 4
Figure 4
Comparative expression of dermal myofibroblasts alpha smooth muscle actin (α-SMA), epidermal K14 and K10 markers during skin wound healing in vehicle, ketanserin and fluoxetine treatment groups. Two weeks post thermal skin wound sections were harvested and immunostained for these markers. (A) Expression of α-SMA in wound dermal fibroblasts (arrow indicate α-SMA + ve cells); (B) Expression of K14 and (C) K10 in newly formed epidermal layers over the wound area (arrow indicate K14 and K10 + ve keratinocytes in separate images). Image scale bar: 100 μm. Graphical results show comparative (D) α-SMA (E) K14 and (F) K10 expression among treatments after two weeks’ post thermal injury. Results were presented as mean ± Standard Deviation (SD), (* p < 0.05), n = 5.

Similar articles

Cited by

References

    1. Jeschke M.G., Patsouris D., Stanojcic M., Abdullahi A., Rehou S., Pinto R., Chen P., Burnett M., Amini-Nik S. Pathophysiologic Response to Burns in the Elderly. EBioMedicine. 2015;2:1536–1548. doi: 10.1016/j.ebiom.2015.07.040. - DOI - PMC - PubMed
    1. Jeschke M.G., Pinto R., Costford S.R., Amini-Nik S. Threshold age and burn size associated with poor outcomes in the elderly after burn injury. Burns. 2016;42:276–281. doi: 10.1016/j.burns.2015.12.008. - DOI - PMC - PubMed
    1. World Health Organization . A WHO Plan for Burn Prevention and Care. World Health Organization; Geneva, Switzerland: 2008. 23p
    1. Latenser B.A., Miller S.F., Bessey P.Q., Browning S.M., Caruso D.M., Gomez M., Jeng J.C., Krichbaum J.A., Lentz C.W., Saffle J.R., et al. National Burn Repository 2006: A ten-year review. J. Burn Care Res. 2007;28:635–658. doi: 10.1097/BCR.0B013E31814B25B1. - DOI - PubMed
    1. Yu Y.M., Tompkins R.G., Ryan C.M., Young V.R. The metabolic basis of the increase of the increase in energy expenditure in severely burned patients. J. Parenter. Enter. Nutr. 1999;23:160–168. doi: 10.1177/0148607199023003160. - DOI - PubMed