Meta-Analysis
. 2018 Mar 29;13(3):e0194555.
doi: 10.1371/journal.pone.0194555. eCollection 2018.

Effectiveness of school food environment policies on children's dietary behaviors: A systematic review and meta-analysis

Affiliations
Meta-Analysis

Effectiveness of school food environment policies on children's dietary behaviors: A systematic review and meta-analysis

Renata Micha et al. PLoS One. .

Abstract

Background: School food environment policies may be a critical tool to promote healthy diets in children, yet their effectiveness remains unclear.

Objective: To systematically review and quantify the impact of school food environment policies on dietary habits, adiposity, and metabolic risk in children.

Methods: We systematically searched online databases for randomized or quasi-experimental interventions assessing effects of school food environment policies on children's dietary habits, adiposity, or metabolic risk factors. Data were extracted independently and in duplicate, and pooled using inverse-variance random-effects meta-analysis. Habitual (within+outside school) dietary intakes were the primary outcome. Heterogeneity was explored using meta-regression and subgroup analysis. Funnel plots, Begg's and Egger's test evaluated potential publication bias.

Results: From 6,636 abstracts, 91 interventions (55 in US/Canada, 36 in Europe/New Zealand) were included, on direct provision of healthful foods/beverages (N = 39 studies), competitive food/beverage standards (N = 29), and school meal standards (N = 39) (some interventions assessed multiple policies). Direct provision policies, which largely targeted fruits and vegetables, increased consumption of fruits by 0.27 servings/d (n = 15 estimates (95%CI: 0.17, 0.36)) and combined fruits and vegetables by 0.28 servings/d (n = 16 (0.17, 0.40)); with a slight impact on vegetables (n = 11; 0.04 (0.01, 0.08)), and no effects on total calories (n = 6; -56 kcal/d (-174, 62)). In interventions targeting water, habitual intake was unchanged (n = 3; 0.33 glasses/d (-0.27, 0.93)). Competitive food/beverage standards reduced sugar-sweetened beverage intake by 0.18 servings/d (n = 3 (-0.31, -0.05)); and unhealthy snacks by 0.17 servings/d (n = 2 (-0.22, -0.13)), without effects on total calories (n = 5; -79 kcal/d (-179, 21)). School meal standards (mainly lunch) increased fruit intake (n = 2; 0.76 servings/d (0.37, 1.16)) and reduced total fat (-1.49%energy; n = 6 (-2.42, -0.57)), saturated fat (n = 4; -0.93%energy (-1.15, -0.70)) and sodium (n = 4; -170 mg/d (-242, -98)); but not total calories (n = 8; -38 kcal/d (-137, 62)). In 17 studies evaluating adiposity, significant decreases were generally not identified; few studies assessed metabolic factors (blood lipids/glucose/pressure), with mixed findings. Significant sources of heterogeneity or publication bias were not identified.

Conclusions: Specific school food environment policies can improve targeted dietary behaviors; effects on adiposity and metabolic risk require further investigation. These findings inform ongoing policy discussions and debates on best practices to improve childhood dietary habits and health.


Conflict of interest statement

Competing Interests: Dr. Micha, Dr. Peñalvo and Dr. Mozaffarian report grants from NIH/NHLBI during the conduct of the study. Dr. Micha is PI of a research grant from Unilever on an investigator-initiated project to assess the effects of omega-6 fatty acid biomarkers on diabetes and heart disease, and reports personal fees from the World Bank; all outside the submitted work. Dr. Mozaffarian reports personal fees from the World Bank, Bunge, Life Sciences Research Organization, Astra Zeneca, Boston Heart Diagnostics, GOED, DSM, Haas Avocado Board, Pollock Communications, and UpToDate; and scientific advisory board, Omada Health and Elysium Health; all outside the submitted work. All other authors declare no competing interests. We affirm that this does not alter our adherence to PLOS ONE policies on sharing data and materials.

Figures

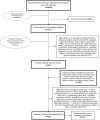
Fig 1
Fig 1. Screening and selection process of interventions evaluating the impact of school food environment policies on dietary habits, adiposity, or metabolic risk factors in children.
Fig 2
Fig 2. Effect of direct provision of fruits and vegetables in schools on fruit and vegetable intake in children.
Intakes represent habitual (not just in-school) consumption. Solid squares represent study specific continuous changes in reported intakes; and lines, 95% confidence intervals (Cis). Vertical line represents pooled effect size (ES); and open diamond, corresponding 95% CI. Multi-component strategies were included only if the food environment policy was a major component, judged qualitatively to be at least 30% of the overall intervention. The relative contribution of the food environment policy component to the overall intervention was qualitatively assessed as low (30 to <60%), medium (60 to <90%), and high (≥90%). a A single estimate was obtained by summing separately reported outcomes (n = 2) that their total aligned to the single optimal definition (i.e., total vegetables, combined fruits and vegetables). b Same intervention reporting outcomes for different counties and ages. RCT, randomized controlled trial; QED, quasi-experimental intervention with external control group; QED, no C, quasi-experimental intervention without external control group; CA, Canada; DK, Denmark; F, Finland; N, Norway; NL, Netherlands; NZ, New Zealand; UK, United Kingdom; US, United States of America.
Fig 3
Fig 3. Effect of competitive food and beverage standards in schools on sugar-sweetened beverage and unhealthy snack intake in children.
Intakes represent habitual or total in-school consumption, except for 1 study that assessed in-school lunch intake. Solid squares represent study specific continuous changes in reported intakes; and lines, 95% confidence intervals (Cis). Vertical line represents pooled effect size (ES); and open diamond, corresponding 95% CI. Multi-component strategies were included only if food environment policy was a major component, judged qualitatively to be at least 30% of the overall intervention. The relative contribution of the food environment policy component to the overall intervention was qualitatively assessed as low (30 to <60%), medium (60 to <90%), and high (≥90%). a A single estimate was obtained by summing separately reported outcomes (n = 2) that their total aligned to the single optimal definition (i.e., sweet snacks). SSBs, sugar-sweetened beverages; RCT, randomized controlled trial; QED, quasi-experimental intervention with external control group; QED, no C, quasi-experimental intervention without external control group; CA, Canada; UK, United Kingdom; US, United States of America.
Fig 4
Fig 4. Effect of school meal standards on total fat and saturated fat intake in children.
Intakes represent habitual or in-school lunch consumption. Solid squares represent study specific continuous changes in reported intakes; and lines, 95% confidence intervals (Cis). Vertical line represents pooled effect size (ES); and open diamond, corresponding 95% CI. Multi-component strategies were included only if the food environment policy was a major component, judged qualitatively to be at least 30% of the overall intervention. The relative contribution of the food environment policy component to the overall intervention was qualitatively assessed as low (30 to <60%), medium (60 to <90%), and high (≥90%). In secondary analysis, in-school meal (lunch or breakfast) consumption decreased for total fat by 7.12% energy (%E)/d (N = 10; -9.48, -4.75) and for saturated fat by 2.46%E/d (N = 10; -4.04, -0.89). RCT, randomized controlled trial; QED, quasi-experimental intervention with external control group; QED, no C, quasi-experimental intervention without external control group; CA, Canada; UK, United Kingdom; US, United States of America.

References

    1. Writing Group M, Mozaffarian D, Benjamin EJ, Go AS, Arnett DK, et al. (2016) Executive Summary: Heart Disease and Stroke Statistics—2016 Update: A Report From the American Heart Association. Circulation 133: 447–454. doi: 10.1161/CIR.0000000000000366 - DOI - PubMed
    1. Craigie AM, Lake AA, Kelly SA, Adamson AJ, Mathers JC (2011) Tracking of obesity-related behaviours from childhood to adulthood: A systematic review. Maturitas 70: 266–284. doi: 10.1016/j.maturitas.2011.08.005 - DOI - PubMed
    1. Simmonds M, Burch J, Llewellyn A, Griffiths C, Yang H, et al. (2015) The use of measures of obesity in childhood for predicting obesity and the development of obesity-related diseases in adulthood: a systematic review and meta-analysis. Health Technol Assess 19: 1–336. - PMC - PubMed
    1. Simmonds M, Llewellyn A, Owen CG, Woolacott N (2016) Predicting adult obesity from childhood obesity: a systematic review and meta-analysis. Obes Rev 17: 95–107. doi: 10.1111/obr.12334 - DOI - PubMed
    1. Birch LL (1998) Development of food acceptance patterns in the first years of life. Proc Nutr Soc 57: 617–624. - PubMed

Publication types

MeSH terms