

Gut microbiota varies by opioid use, circulating leptin and oxytocin in African American men with diabetes and high burden of chronic disease
- PMID: 29596446
- PMCID: PMC5875756
- DOI: 10.1371/journal.pone.0194171
Gut microbiota varies by opioid use, circulating leptin and oxytocin in African American men with diabetes and high burden of chronic disease
Abstract
Objective: The gut microbiota is known to be related to type 2 diabetes (T2D), psychiatric conditions, and opioid use. In this study, we tested the hypothesis that variability in gut microbiota in T2D is associated with psycho-metabolic health.
Methods: A cross-sectional study was conducted among African American men (AAM) (n = 99) that were outpatients at a Chicago VA Medical Center. The main outcome measures included fecal microbiota ecology (by 16S rRNA gene sequencing), psychiatric disorders including opioid use, and circulating leptin and oxytocin as representative hormone biomarkers for obesity and psychological pro-social behavior.
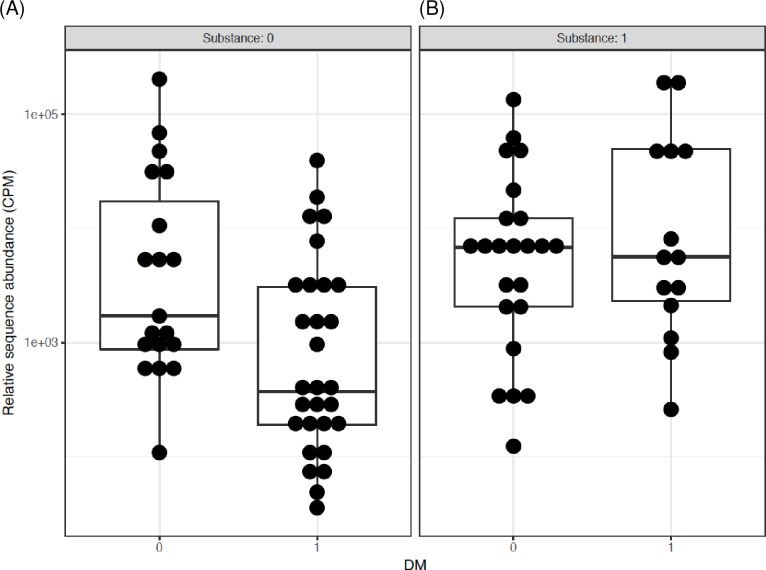
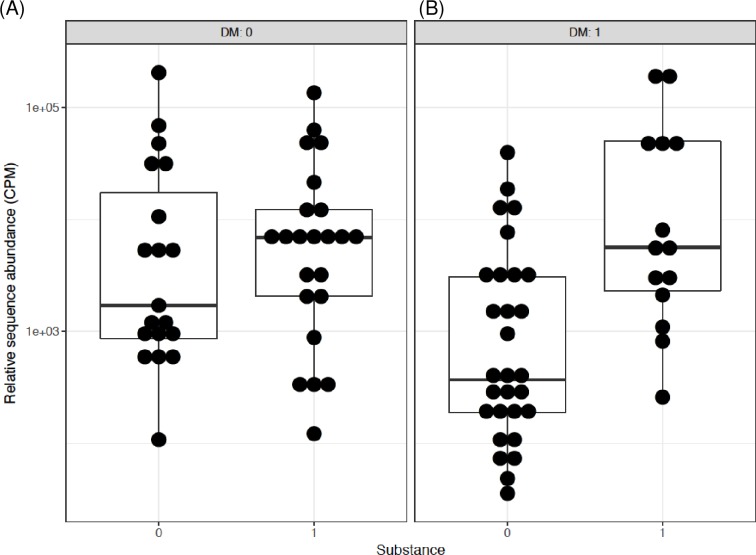
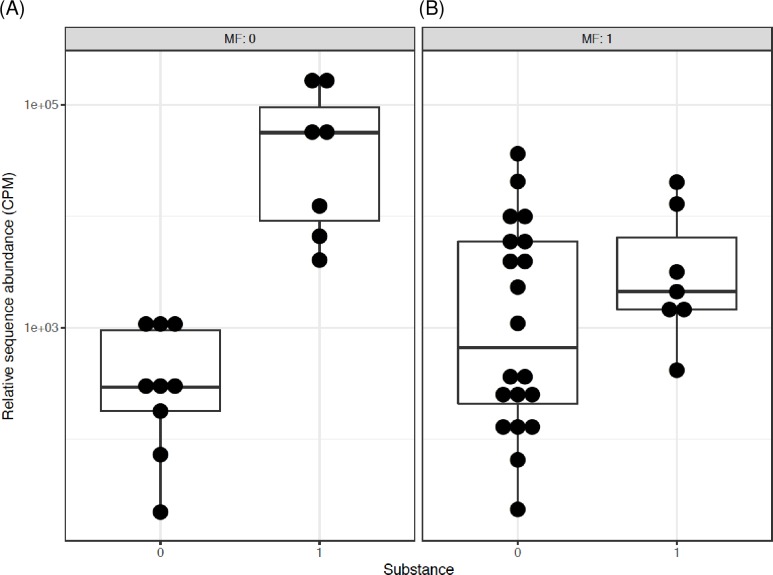
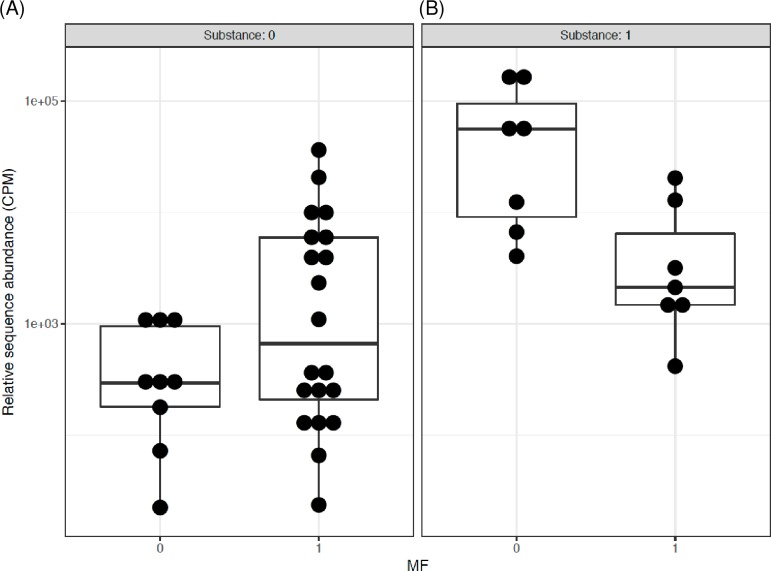
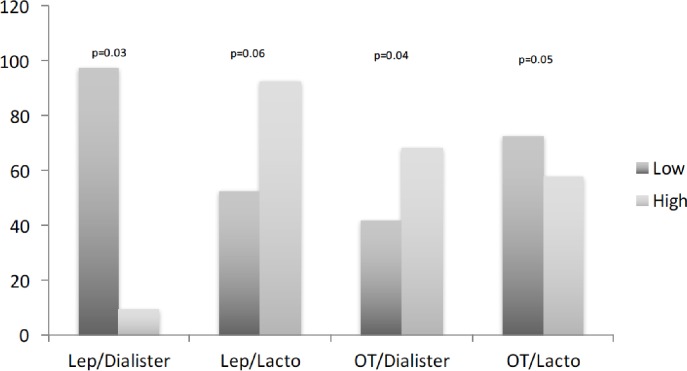
Results: The study subjects had prevalent overweight/obesity (78%), T2D (50%) and co-morbid psychiatric (65%) and opioid use (45%) disorders. In the analysis of microbiota, the data showed interactions of opioids, T2D and metformin with Bifidobacterium and Prevotella genera. The differential analysis of Bifidobacterium stratified by opioids, T2D and metformin, showed significant interactions among these factors indicating that the effect of one factor was changed by the other (FDR-adjusted p [q] < 0.01). In addition, the pair-wise comparison showed that participants with T2D not taking metformin had a significant 6.74 log2 fold increase in Bifidobacterium in opioid users as compared to non-users (q = 2.2 x 10⁻⁸). Since metformin was not included in this pair-wise comparison, the significant 'q' suggested association of opioid use with Bifidobacterium abundance. The differences in Bifidobacterium abundance could possibly be explained by opioids acting as organic cation transporter 1 (OCT1) inhibitors. Analysis stratified by lower and higher leptin and oxytocin (divided by the 50th percentile) in the subgroup without T2D showed lower Dialister in High-Leptin vs. Low-Leptin (p = 0.03). Contrary, the opposite was shown for oxytocin, higher Dialister in High-Oxytocin vs. Low-Oxytocin (p = 0.04).
Conclusions: The study demonstrated for the first time that Bifidobacterium and Prevotella abundance was affected by interactions of T2D, metformin and opioid use. Also, in subjects without T2D Dialister abundance varied according to circulating leptin and oxytocin.
Conflict of interest statement
Figures
Similar articles
-
Gut microbiota in patients with COVID-19 and type 2 diabetes: A culture-based method.Front Cell Infect Microbiol. 2023 Feb 9;13:1142578. doi: 10.3389/fcimb.2023.1142578. eCollection 2023. Front Cell Infect Microbiol. 2023. PMID: 36844398 Free PMC article.
-
Trans-ethnic gut microbiota signatures of type 2 diabetes in Denmark and India.Genome Med. 2021 Mar 3;13(1):37. doi: 10.1186/s13073-021-00856-4. Genome Med. 2021. PMID: 33658058 Free PMC article.
-
Metformin Is Associated With Higher Relative Abundance of Mucin-Degrading Akkermansia muciniphila and Several Short-Chain Fatty Acid-Producing Microbiota in the Gut.Diabetes Care. 2017 Jan;40(1):54-62. doi: 10.2337/dc16-1324. Epub 2016 Nov 14. Diabetes Care. 2017. PMID: 27999002
-
Role of gut microbiota in type 2 diabetes pathophysiology.EBioMedicine. 2020 Jan;51:102590. doi: 10.1016/j.ebiom.2019.11.051. Epub 2020 Jan 3. EBioMedicine. 2020. PMID: 31901868 Free PMC article. Review.
-
Effects of Non-insulin Anti-hyperglycemic Agents on Gut Microbiota: A Systematic Review on Human and Animal Studies.Front Endocrinol (Lausanne). 2020 Sep 23;11:573891. doi: 10.3389/fendo.2020.573891. eCollection 2020. Front Endocrinol (Lausanne). 2020. PMID: 33071980 Free PMC article.
Cited by
-
Gastrointestinal motility, dysbiosis and opioid-induced tolerance: is there a link?Nat Rev Gastroenterol Hepatol. 2019 Jun;16(6):323-324. doi: 10.1038/s41575-019-0150-x. Nat Rev Gastroenterol Hepatol. 2019. PMID: 31024090 Free PMC article. Review.
-
Astragalus alters gut-microbiota composition in type 2 diabetes mice: clues to its pharmacology.Diabetes Metab Syndr Obes. 2019 May 17;12:771-778. doi: 10.2147/DMSO.S203239. eCollection 2019. Diabetes Metab Syndr Obes. 2019. PMID: 31190935 Free PMC article.
-
Gut microbiota profiling in injection drug users with and without HIV-1 infection in Puerto Rico.Front Microbiol. 2024 Nov 26;15:1470037. doi: 10.3389/fmicb.2024.1470037. eCollection 2024. Front Microbiol. 2024. PMID: 39697649 Free PMC article.
-
Exploring the Gut and Oral Microbiomes in Psychoactive Substance Use: A Scoping Review of Clinical Studies.J Neurochem. 2025 Jul;169(7):e70165. doi: 10.1111/jnc.70165. J Neurochem. 2025. PMID: 40709626 Free PMC article.
-
The Microbiome-Gut-Brain Axis, a Potential Therapeutic Target for Substance-Related Disorders.Front Microbiol. 2021 Oct 6;12:738401. doi: 10.3389/fmicb.2021.738401. eCollection 2021. Front Microbiol. 2021. PMID: 34690981 Free PMC article. Review.
References
-
- Semenkovich CF, Danska J, Darsow T, Dunne JL, Huttenhower C, Insel RA, et al. American Diabetes Association and JDRF Research Symposium: Diabetes and the Microbiome. Diabetes. 2015;64(12):3967–77. doi: 10.2337/db15-0597 - DOI - PMC - PubMed
-
- Barengolts E. Gut microbiota, prebiotics, probiotics, and synbiotics in management of obesity and prediabetes: review of randomized controlled trials. Endocr Pract. 2016;22(10): 1224–34. doi: 10.4158/EP151157.RA - DOI - PubMed
-
- Kleiman SC, Watson HJ, Bulik-Sullivan EC, Huh EY, Tarantino LM, Bulik CM et al. The Intestinal Microbiota in Acute Anorexia Nervosa and During Renourishment: Relationship to Depression, Anxiety, and Eating Disorder Psychopathology. Psychosom Med. 2015;77(9):969–81. doi: 10.1097/PSY.0000000000000247 - DOI - PMC - PubMed
-
- Christian LM, Galley JD, Hade EM, Schoppe-Sullivan S, Kamp Dush C, Bailey MT. Gut microbiome composition is associated with temperament during early childhood. Brain Behav Immun. 2015;45:118–27. doi: 10.1016/j.bbi.2014.10.018 - DOI - PMC - PubMed
Publication types
MeSH terms
Substances
Grants and funding
LinkOut - more resources
Full Text Sources
Other Literature Sources
Medical
