. 2018 Mar 29;16(3):e2002417.
doi: 10.1371/journal.pbio.2002417. eCollection 2018 Mar.

The colonic epithelium plays an active role in promoting colitis by shaping the tissue cytokine profile

Affiliations

The colonic epithelium plays an active role in promoting colitis by shaping the tissue cytokine profile

Jesse Lyons et al. PLoS Biol. .

Abstract

Inflammatory bowel disease (IBD) is a chronic condition driven by loss of homeostasis between the mucosal immune system, the commensal gut microbiota, and the intestinal epithelium. Our goal is to understand how these components of the intestinal ecosystem cooperate to control homeostasis. By combining quantitative measures of epithelial hyperplasia and immune infiltration with multivariate analysis of inter- and intracellular signaling, we identified epithelial mammalian target of rapamycin (mTOR) signaling as a potential driver of inflammation in a mouse model of colitis. A kinetic analysis of mTOR inhibition revealed that the pathway regulates epithelial differentiation, which in turn controls the cytokine milieu of the colon. Consistent with our in vivo analysis, we found that cytokine expression of organoids grown ex vivo, in the absence of bacteria and immune cells, was dependent on differentiation state. Our study suggests that proper differentiation of epithelial cells is an important feature of colonic homeostasis because of its effect on the secretion of inflammatory cytokines.


Conflict of interest statement

The authors have declared that no competing interests exist.

Figures

Fig 1
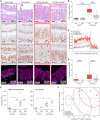
Fig 1. Phenotypic characterization of murine colitis.
(A) Representative histology of colons from control regulatory T cell (Treg)-injected animals and naïve T-injected animals with inflammation. The left panels show hematoxylin–eosin (HE)-stained colons; the center panels show immunohistochemistry for Ki-67, a marker of undifferentiated cells; and the right panels show immunohistochemistry for mucin-2, a marker for goblet cells. (B) Plot of average crypt height in distal colon versus the percentage of total CD45+ immune cells in the tissue, showing a strong positive relationship. R was determined by Spearman correlation. (C) Plot of average crypt height in distal colon versus weight loss score, showing a strong linear relationship. R was determined by Pearson correlation. (D) Plot of the percentage of total CD45+ immune cells in the colon versus weight loss score, showing a strong linear relationship. R was determined by Pearson correlation. (E) Scatter plots of crypt height profiles for the animals from panel A. Each dot represents a single crypt measurement and its location within the colon from distal to proximal colon. Focal and continuous inflammation classes were defined based on these profiles, with focal inflammation showing the variable phenotype (blue dots) and continuous inflammation showing consistent distal colon hyperplasia (red dots). The box at the bottom provides the immune infiltrate score at each location where crypts were measured, showing co-occurrence of hyperplasia and foci of immune infiltration. (F) Average crypt height profiles for each group, with the standard error about the mean indicated in shaded regions at points binned in 500-μm increments. N = 6, 7, and 8 for control, focal inflammation, and continuous inflammation, respectively. Underlying numerical values for panels B–F are provided in S1 Data.
Fig 2
Fig 2. Multivariate molecular analysis of murine colitis.
(A) Principal component analysis (PCA) based on Luminex measurements from distal colons identifies clusters of the control, focal inflammation, and continuous inflammation classes on principal component 1 (PC1). (B) Correlation between PCA and crypt height. For each animal, the score on PC1 was plotted against the average crypt height in the distal colon. This indicates that there is a strong correlation (R2 = 0.8) between PC1 and epithelial measures of inflammation. (C) Loadings on PC1 represented as single dots for each protein and grouped and color-coded by pathway or category. Signals on the right are positively correlated with inflammation. (D) Immunohistochemistry for p-S6 ribosomal protein (p-S6RP), a readout of the mammalian target of rapamycin (mTOR) pathway. p-S6RP was strongly induced in inflamed animals and was found primarily in epithelial cells. Underlying numerical values for panels A and B are provided in S1 Data. MAPK, mitogen-activated protein kinase.
Fig 3
Fig 3. Mammalian target of rapamycin (mTOR) inhibition reduces inflammation.
(A) Representative histology of colons from vehicle (Veh.)-treated control animals, rapamycin (Rap.)-treated control animals, vehicle-treated and naïve T-injected animals, and rapamycin-treated and naïve T-injected animals. Individual panels show (from top to bottom) hematoxylin–eosin (HE)-stained colons, Ki-67, mucin-2, and Foxp3, a marker of regulatory T cells (Tregs). (B) Measurement of proliferative zone heights via Ki-67 staining. There is a significant reduction in crypt height for inflamed rapamycin-treated animals, as determined by Mann-Whitney test. *** represents p ≤ 0.001. N = 100, 60, 80, and 120 for control + vehicle, control + rapamycin, naïve T + vehicle, and naïve T + rapamycin, respectively. (C) Average crypt height profiles for each treatment group, with the standard error about the mean indicated in shaded regions at points binned in 500-μm increments. N = 4, 3, 6, and 8 for control + vehicle, control + rapamycin, naïve T + vehicle, and naïve T + rapamycin, respectively. (D) Quantification of Foxp3-positive Tregs. There is a significant reduction in Tregs in the lamina propria of all animals treated with rapamycin. Tregs were quantified as the number of Foxp3-positive cells in a random high-powered field (HPF). P-values were determined by Mann-Whitney test. *** represents p ≤ 0.001. N = 75, 50, 100, and 75 for control + vehicle, control + rapamycin, naïve T + vehicle, and naïve T + rapamycin, respectively. (E) Luminex-based measurements of activating phosphorylation sites on multiple proteins in the mTOR pathway. Measurements are in arbitrary relative fluorescence units (RFUs). Horizontal and vertical lines represent mean +/− standard error. Significance was determined by one-way ANOVA with Tukey-Kramer post-test. * represents p ≤ 0.05; ** represents p ≤ 0.01. (F) Projection of signaling data from vehicle- and rapamycin-treated samples onto a partial least squares regression (PLSR) model built from untreated samples. Original samples used to generate the model project into the gray oval (control), blue oval (focal inflammation), and red oval (continuous inflammation). Underlying numerical values for panels B–F are provided in S1 Data.
Fig 4
Fig 4. Temporal control of cellular and molecular inflammatory phenotypes by rapamycin.
(A) Representative Alcian Blue/Periodic Acid Schiff (AB/PAS) stains for inflamed animals treated with vehicle (Veh.) or rapamycin (Rap.) for the indicated periods of time. Intracellular and extracellular mucins are stained dark purple and indicate the appearance of mature goblet cells. (B) Measurement of the proliferative zone before and after rapamycin. The proliferative zone is defined as the ratio of the highest phosphorylated histone H3 (PH3)-positive cell position in a crypt divided by the height of that crypt. For each animal, 12–25 crypts were measured, and bars represent the average proliferative zone for 2–3 animals. Significance was determined by one-way ANOVA with Tukey-Kramer post-test. * represents p ≤ 0.05; ** represents p ≤ 0.01. Bar graphs represent mean +/− standard error. (C) Average crypt height profiles for each treatment group, with the standard error about the mean indicated in shaded regions at points binned in 500-μm increments. N = at least 2 for each group. (D) Flow cytometric measurements of colonic immune infiltrate. Inflamed animals show an even mix of T cells, macrophages, and neutrophils, but rapamycin treatment leads to a loss of macrophages and neutrophils by 48 hours. Significance determined by ANOVA with Tukey-Kramer post-test. * represents p ≤ 0.05; ** represents p ≤ 0.01, both with respect to naïve T, vehicle control. N = 2–3 animals per condition. Bar graphs represent mean +/− standard error. (E) Representative cytokine expression patterns of response to acute rapamycin treatment. Macrophage colony-stimulating factor (M-CSF) drops immediately follow rapamycin exposure, while macrophage inflammatory protein 1-alpha (MIP-1α) declines slowly over 24 hours. Some proteins, like interleukin (IL)-6, transiently increase in expression following rapamycin treatment. N = 2–3 animals per condition. Bar graphs represent mean +/− standard error. Underlying numerical values for panels B–E are provided in S1 Data.
Fig 5
Fig 5. Goblet cell differentiation leads to reduced cytokine expression and innate immune cell infiltration.
(A) Alcian Blue/Periodic Acid Schiff (AB/PAS) stain for mucin shows loss of goblet cells in inflamed animals that is restored by treatment with the Notch pathway inhibitor dibenzazepine (DBZ). (B) Immune infiltrate, as measured by flow cytometry expressed as a percentage of total cells, shows a reduction in macrophages and neutrophils following 1-week treatment with DBZ. Significance determined by unpaired t test, with p-values indicated above each cell type. N = 2–3 animals per condition. Bar graphs represent mean +/− standard error. (C) Inflammation-associated cytokine and chemokine expression was measured by Luminex and displayed as log2-fold changes versus control animals. These proteins represent the top 20 loadings from the partial least squares regression (PLSR) model described in Fig 5D. Data for individual animals are presented in S8 Fig. (D) DBZ- and vehicle (Veh.)-treated cytokine and chemokine measurements were projected onto a PLSR model built from non-drug-treated animals. DBZ-treated animals cluster with focal inflamed and noninflamed animals. Original samples used to generate the model project into the gray rectangle (control), blue rectangle (focal inflammation), and red rectangle (continuous inflammation). Underlying numerical values for panels B–D are provided in S1 Data. Avg, average; IFNγ, interferon gamma; IL, interleukin; LIF, leukemia inhibitory factor; LV1, latent variable 1; MCP-1, monocyte chemoattractant protein 1; MIG, mitokine induced by gamma interferon; MIP-1α/β, macrophage inflammatory protein 1-alpha/beta; M-CSF, macrophage colony-stimulating factor; RANTES, regulated on activation, normal T cell expressed and secreted; VEGF, vascular endothelial growth factor.
Fig 6
Fig 6. Expansion of transit amplifying cells in animals with colitis.
(A) Markers of goblet cells, enterocytes (Ent.), enteroendocrine cells (EE), and stem cells measured by RNA microarray. Each gene was mean centered, and the means of inflamed and noninflamed groups are indicated in red and gray, respectively. Horizontal and vertical lines represent mean +/− standard error. Significance was determined by unpaired t test. * represents p ≤ 0.05, ** represents p ≤ 0.01, *** represents p ≤ 0.001. (B) Average fold change between inflamed and noninflamed groups for each of the genes in panel A. (C) Enrichment plots for experimentally derived gene sets for secretory progenitors (Secpro), stem cells, enterocytes (Ent), goblet cell-deficient epithelium (Atoh null), and transit-amplifying cell (TAC) epithelium. (D) Normalized enrichment scores for the gene sets indicated in panel C; false discovery rate (FDR) values are indicated above or below each bar. (E) Mean-centered expression values of the 4 chemokines found in the TAC gene set. The means of inflamed and noninflamed groups are indicated in red and gray, respectively. Horizontal and vertical lines represent mean +/− standard error. All genes showed a p < 0.001 in a t test, as indicated by ***. Underlying numerical values for panels A and C–E are provided in S1 Data.
Fig 7
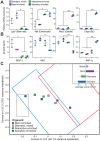
Fig 7. Epithelial differentiation reduces inflammatory cytokine expression in colonic organoids.
(A) RNA markers of stem cells (Lgr5), enterocytes (Alpi), and goblet cells (Muc2) and enteroendocrine cells (Chga) were measured by quantitative polymerase chain reaction (qPCR) and normalized to standard culture condition organoid expression levels. Conditions for enrichment of stem cells or specific differentiated lineages can be found in the Materials and methods section. Horizontal and vertical lines represent mean +/− standard error. Significance was determined by ANOVA with Tukey-Kramer post-test. * represents p ≤ 0.05; *** represents p ≤ 0.001. (B) Representative cytokines, chemokines, and growth factors were measured by Luminex and represented in pg/ml. Horizontal and vertical lines represent mean +/− standard error. Significance was determined by ANOVA with Tukey-Kramer post-test. * represents p ≤ 0.05; ** represents p ≤ 0.01. (C) A partial least squares regression (PLSR) model built on cytokine, chemokine, and growth factor measurements from the mouse experiment described in Fig 1 with organoid protein expression data projected. Differentiated organoids project with focal inflammation and control groups, while proliferative, stem-like organoids are projected with the continuous inflammation group. Original samples used to generate the model project into the gray rectangle (control), blue rectangle (focal inflammation), and red rectangle (continuous inflammation). Underlying numerical values for panels A–C are provided in S1 Data. MCP-1, monocyte chemoattractant protein 1; MIG, mitokine induced by gamma interferon; MIP-1α, macrophage inflammatory protein 1-alpha.

Similar articles

Cited by

References

    1. Mowat C, Cole A, Windsor A, Ahmad T, Arnott I, Driscoll R, et al. Guidelines for the management of inflammatory bowel disease in adults. Gut. 2011;60(5):571–607. doi: 10.1136/gut.2010.224154 . - DOI - PubMed
    1. Jostins L, Ripke S, Weersma RK, Duerr RH, McGovern DP, Hui KY, et al. Host-microbe interactions have shaped the genetic architecture of inflammatory bowel disease. Nature. 2012;491(7422):119–24. doi: 10.1038/nature11582 . - DOI - PMC - PubMed
    1. Khor B, Gardet A, Xavier RJ. Genetics and pathogenesis of inflammatory bowel disease. Nature. 2011;474(7351):307–17. doi: 10.1038/nature10209 . - DOI - PMC - PubMed
    1. Roda G, Sartini A, Zambon E, Calafiore A, Marocchi M, Caponi A, et al. Intestinal epithelial cells in inflammatory bowel diseases. World J Gastroenterol. 2010;16(34):4264–71. doi: 10.3748/wjg.v16.i34.4264 . - DOI - PMC - PubMed
    1. Peterson LW, Artis D. Intestinal epithelial cells: regulators of barrier function and immune homeostasis. Nat Rev Immunol. 2014;14(3):141–53. doi: 10.1038/nri3608 . - DOI - PubMed

Publication types

MeSH terms