

Coupled ultradian growth and curvature oscillations during gravitropic movement in disturbed wheat coleoptiles
- PMID: 29596500
- PMCID: PMC5875799
- DOI: 10.1371/journal.pone.0194893
Coupled ultradian growth and curvature oscillations during gravitropic movement in disturbed wheat coleoptiles
Abstract
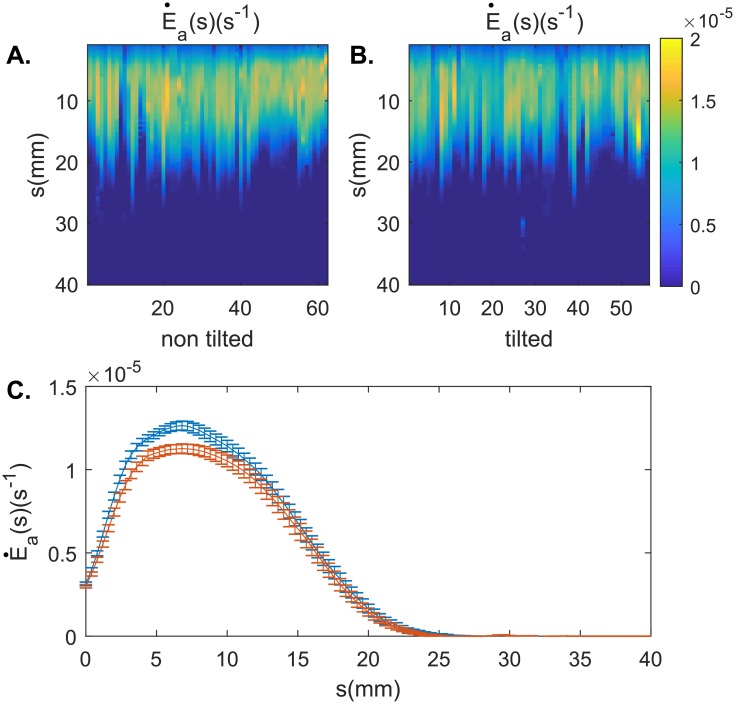
To grow straight and upright, plants need to regulate actively their posture. Gravitropic movement, which occurs when plants modify their growth and curvature to orient their aerial organ against the force of gravity, is a major feature of this postural control. A recent model has shown that graviception and proprioception are sufficient to account for the gravitropic movement and subsequent organ posture demonstrated by a range of species. However, some plants, including wheat coleoptiles, exhibit a stronger regulation of posture than predicted by the model. Here, we performed an extensive kinematics study on wheat coleoptiles during a gravitropic perturbation (tilting) experiment in order to better understand this unexpectedly strong regulation. Close temporal observations of the data revealed that both perturbed and unperturbed coleoptiles showed oscillatory pulses of elongation and curvature variation that propagated from the apex to the base of their aerial organs. In perturbed coleoptiles, we discovered a non-trivial coupling between the oscillatory dynamics of curvature and elongation. The relationship between those oscillations and the postural control of the organ remains unclear, but indicates the presence of a mechanism that is capable of affecting the relationship between elongation rate, differential growth, and curvature.
Conflict of interest statement
Figures


Similar articles
-
Spatial organization of the gravitropic response in plants: applicability of the revised local curvature distribution model to Triticum aestivum coleoptiles.New Phytol. 1999 Aug;143(2):401-7. doi: 10.1046/j.1469-8137.1999.00459.x. New Phytol. 1999. PMID: 11542912
-
Gravitropism of oat and wheat coleoptiles: dependence on the stimulation angle and involvement of autotropic straightening.Plant Cell Physiol. 1997 Dec;38(12):1346-53. doi: 10.1093/oxfordjournals.pcp.a029128. Plant Cell Physiol. 1997. PMID: 11536867
-
Circumnutational movement in rice coleoptiles involves the gravitropic response: analysis of an agravitropic mutant and space-grown seedlings.Physiol Plant. 2019 Mar;165(3):464-475. doi: 10.1111/ppl.12824. Epub 2018 Oct 2. Physiol Plant. 2019. PMID: 30159898
-
Posture control in land plants: growth, position sensing, proprioception, balance, and elasticity.J Exp Bot. 2019 Jul 23;70(14):3467-3494. doi: 10.1093/jxb/erz278. J Exp Bot. 2019. PMID: 31305901 Review.
-
The power and control of gravitropic movements in plants: a biomechanical and systems biology view.J Exp Bot. 2009;60(2):461-86. doi: 10.1093/jxb/ern341. J Exp Bot. 2009. PMID: 19264759 Review.
Cited by
-
A digital sensor to measure real-time leaf movements and detect abiotic stress in plants.Plant Physiol. 2021 Nov 3;187(3):1131-1148. doi: 10.1093/plphys/kiab407. Plant Physiol. 2021. PMID: 34618089 Free PMC article.
-
Plants sum and subtract stimuli over different timescales.Proc Natl Acad Sci U S A. 2023 Oct 17;120(42):e2306655120. doi: 10.1073/pnas.2306655120. Epub 2023 Oct 10. Proc Natl Acad Sci U S A. 2023. PMID: 37816057 Free PMC article.
-
High-Resolution Kinematic Analysis of Root Gravitropic Bending Using RootPlot.Methods Mol Biol. 2022;2368:95-109. doi: 10.1007/978-1-0716-1677-2_7. Methods Mol Biol. 2022. PMID: 34647251
References
-
- Moulia B, Coutand C, Lenne C. Posture control and skeletal mechanical acclimation in terrestrial plants: Implications for mechanical modeling of plant architecture. American Journal of Botany. 2006;93(10):1477–1489. doi: 10.3732/ajb.93.10.1477 - DOI - PubMed
-
- Moulia B, Fournier M. The power and control of gravitropic movements in plants: a biomechanical and systems biology view. J Exp Bot. 2009;60(2):461–486. doi: 10.1093/jxb/ern341 - DOI - PubMed
-
- Silk WK. Quantitative descriptions of development. Annual Review of Plant Physiology. 1984;35:479–518. doi: 10.1146/annurev.pp.35.060184.002403 - DOI
-
- Band LR, Wells DM, Larrieu A, Sun J, Middleton AM, French AP, et al. Root gravitropism is regulated by a transient lateral auxin gradient controlled by a tipping-point mechanism. Proceedings of the National Academy of Sciences. 2012;109(12):4668–4673. doi: 10.1073/pnas.1201498109 - DOI - PMC - PubMed
-
- Bastien R, Douady S, Moulia B. A unifying modeling of plant shoot gravitropism with an explicit account of the effects of growth. Frontiers in plant science. 2014;5:136 doi: 10.3389/fpls.2014.00136 - DOI - PMC - PubMed
MeSH terms
LinkOut - more resources
Full Text Sources
Other Literature Sources
Miscellaneous
