. 2018 Mar 29;13(3):e0194464.
doi: 10.1371/journal.pone.0194464. eCollection 2018.

Pluripotency gene network dynamics: System views from parametric analysis

Affiliations

Pluripotency gene network dynamics: System views from parametric analysis

Ilya R Akberdin et al. PLoS One. .

Abstract

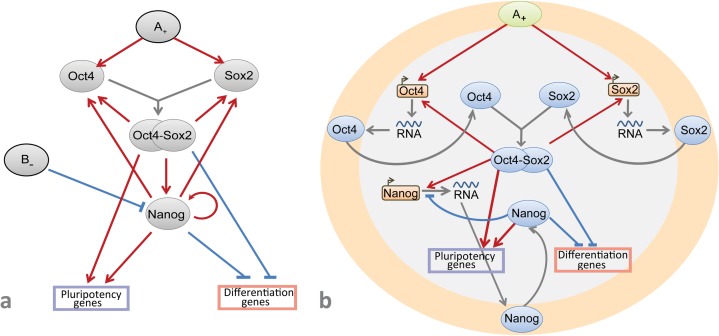
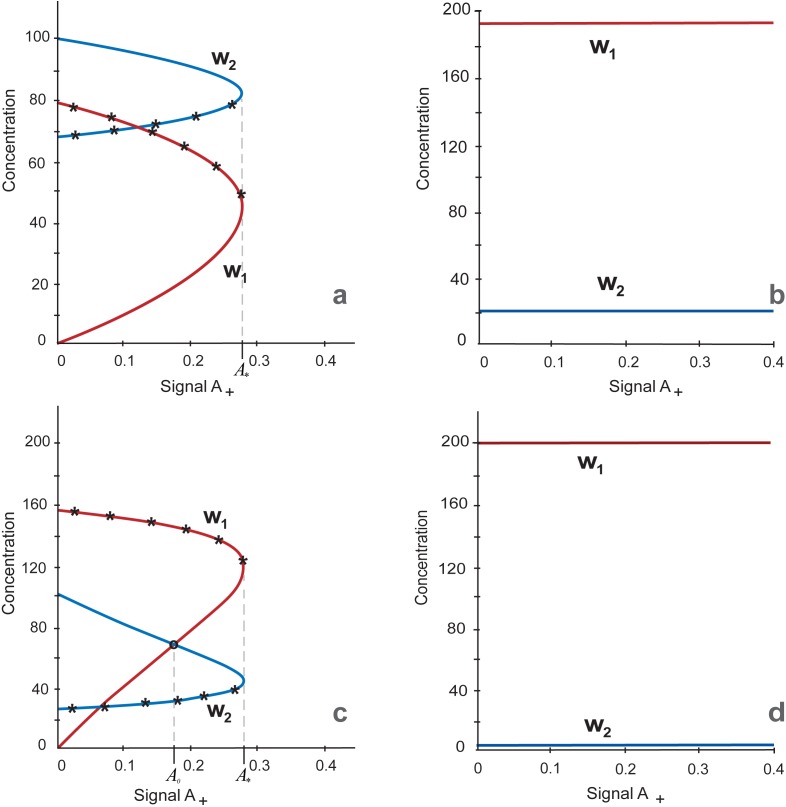
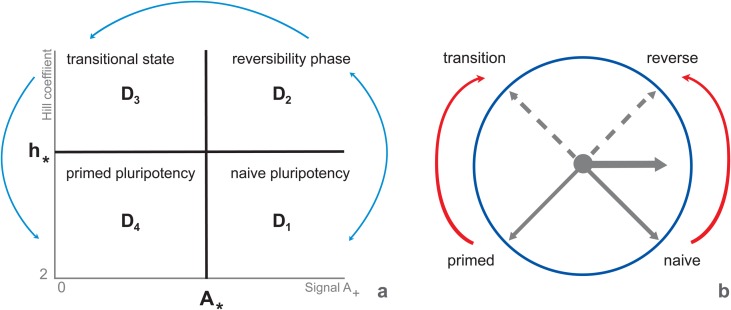
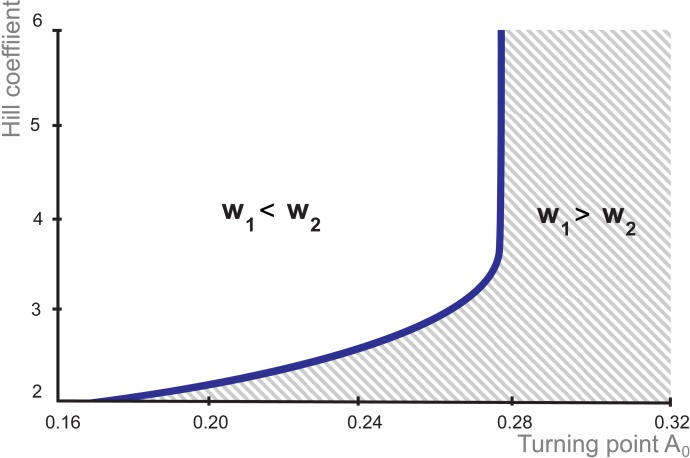
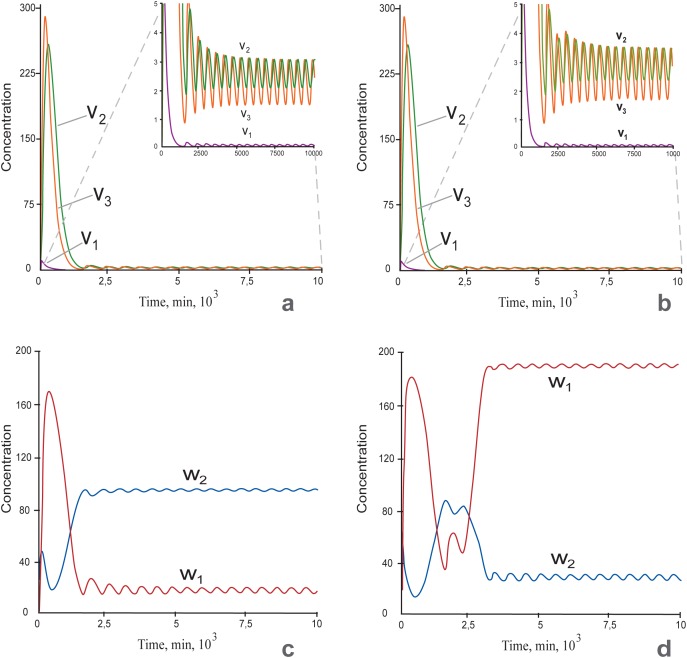
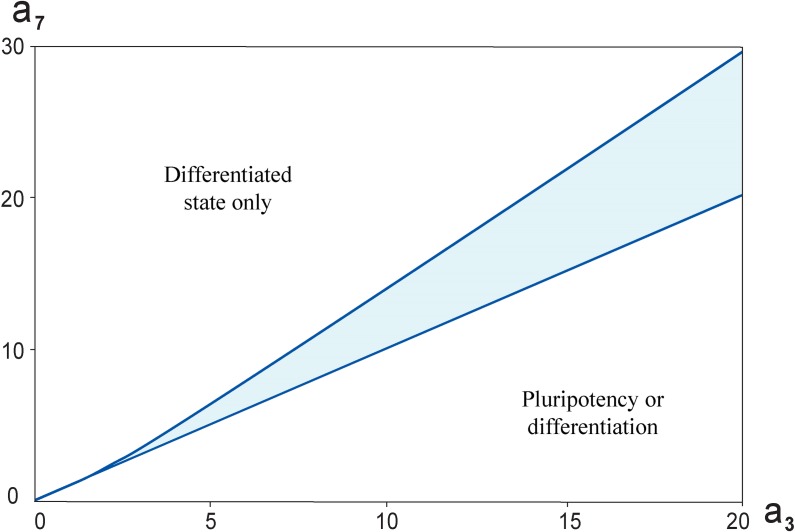
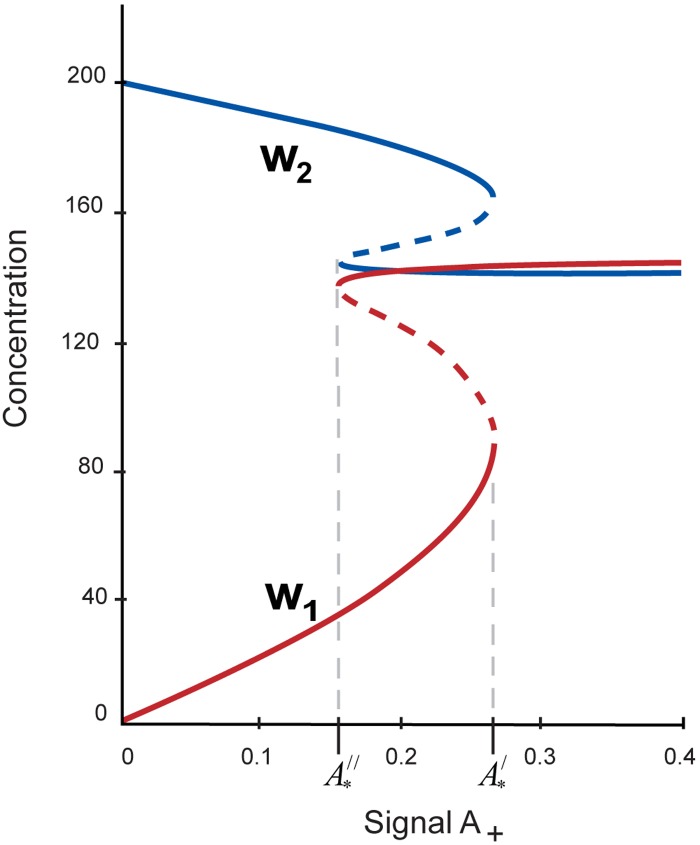
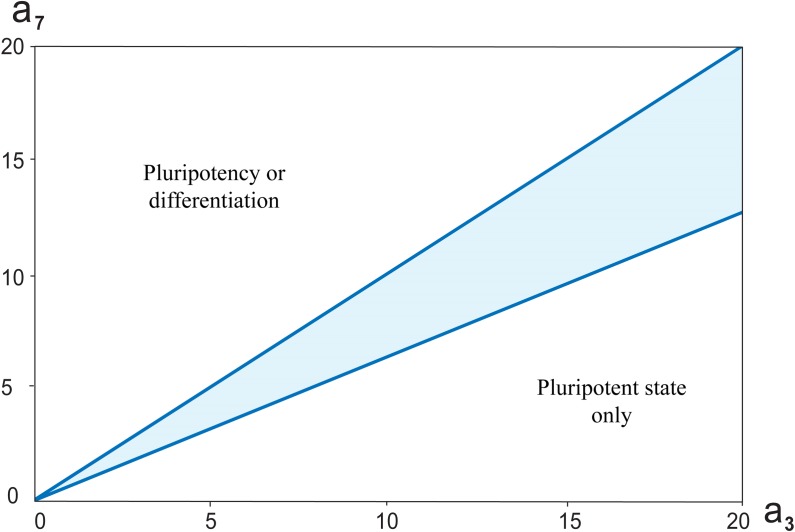
Multiple experimental data demonstrated that the core gene network orchestrating self-renewal and differentiation of mouse embryonic stem cells involves activity of Oct4, Sox2 and Nanog genes by means of a number of positive feedback loops among them. However, recent studies indicated that the architecture of the core gene network should also incorporate negative Nanog autoregulation and might not include positive feedbacks from Nanog to Oct4 and Sox2. Thorough parametric analysis of the mathematical model based on this revisited core regulatory circuit identified that there are substantial changes in model dynamics occurred depending on the strength of Oct4 and Sox2 activation and molecular complexity of Nanog autorepression. The analysis showed the existence of four dynamical domains with different numbers of stable and unstable steady states. We hypothesize that these domains can constitute the checkpoints in a developmental progression from naïve to primed pluripotency and vice versa. During this transition, parametric conditions exist, which generate an oscillatory behavior of the system explaining heterogeneity in expression of pluripotent and differentiation factors in serum ESC cultures. Eventually, simulations showed that addition of positive feedbacks from Nanog to Oct4 and Sox2 leads mainly to increase of the parametric space for the naïve ESC state, in which pluripotency factors are strongly expressed while differentiation ones are repressed.


Conflict of interest statement

Competing Interests: The authors have declared that no competing interests exist.

Figures

Fig 1
Fig 1
A: The core transcriptional network of the factors orchestrating the pluripotency and differentiation genes (suggested by [10]). External A+ and B- signals activate and repress expression of Oct4, Sox2 and Nanog genes, correspondingly. Oct4 and Sox2 form a heterodimer, Oct4/Sox2, which positively regulates Oct4, Sox2 and Nanog expression. Nanog directly induces Oct4, Sox2 and its own expression. Oct4/Sox2 heterodimer and Nanog positively regulate pluripotency genes and repress differentiation genes. B: The revised core gene network suggested in this paper, in which transcription and translation processes were added; external signal B- is removed and positive signal A+ activates transcription of Oct4 и Sox2 genes. Nanog represses its own transcription and does not influence on Oct4 and Sox2 expression.
Fig 2
Fig 2. Multiplicity of stationary solutions representing as w1 and w2 dependence on the parameter A, 0A0.4 at h = 6 (2a and 2b) and h = 2 (2c and 2d).
a. Initial steady state values w2>w1 and A = 0 simulate differentiation state. The w1/w2 ratio while A is growing upon A = A* = 0.277 (the turning point), corresponds to the differentiation steady state. Asterisks indicate arcs of the graphs with unstable solutions. b. Initial steady state values w1> w2 and A ˃ A* simulate the pluripotent state. The graph of the steady state while decreasing A upon A ≥ 0 (including the range 0A ˂ A*) is depicted. Both Fig 2A and 2B show that three states (two stable and one unstable) exist in the range 0 ≤ A ˂ A* = 0.277, while there is one steady state, when A ˃ A*. c. Stationary solution with initial steady state values w2>w1 and A = 0 corresponding to the differentiated cell. w1 and w2 variables have turning points at A = A*. Asterisks indicate unstable solutions. d. Stationary solution with initial steady state values corresponding to the pluripotent cell. The Fig 2C and 2D shows that three states (two are stables and one is unstable) exist in the range 0A ˂ A* = 0.277, while there is one steady state, when A ˃ A* and this is the pluripotent state only.
Fig 3
Fig 3. Multiplicity and stability of stationary solutions depending on parameters A and h. D4 domain comprises a single stable steady state, pluripotency; D2domain encompasses a single unstable state (oscillation).
D3 domain includes three unstable states (oscillations); D4 domain contains three states, from which two (pluripotency and differentiation) are stable and one (transition between these states is unstable (according to Fig 2A). Domains (a) predicted by the model and (b) their correspondence to developmental progression of ESCs from the naïve pluripotency (the ground state) to lineage commitment according to [61]. The initial phase of exit from the ground state is asynchronous in the cell population and reversible until the complete dissipation of naïve state factors (reviewed in [59, 61, 62]). Cells reaching a transitional point after 2i withdrawal are competent for lineage specification and characterized by the absence of both groups, naïve factors and lineage markers. The late phase of pluripotency (primed pluripotency) is characterized by nascent expression of lineage specification factors. The “clock model” was proposed as a route of consistent transitions with the dual mechanism of hour hand movement depending on the initial cell state: pluripotent (counter-clockwise movement of black solid arrows) or differentiated (clockwise movement of black solid arrows). Red arrows, in turn, reflects directions from naïve to reverse-transition-primed stages (developmental progression during differentiation) or from primed to transition-reverse-naïve states (developmental progression during reprogramming into pluripotent state), while dotted black arrows were added to underline intermediate reverse and transitional states to which domains D2 and D3 correspond, respectively.
Fig 4
Fig 4. Dependence of the Hill coefficient value on the value of OS activating signal at which transition from differentiation to pluripotency occurs.
The horizontal and vertical axes represent the values of parameters A0 and h, respectively. The curve distinguishes between pluripotency and differentiation states.
Fig 5
Fig 5
a-b: Time series of mRNA and protein expressions for Nanog at h = 10: v1Nanog mRNA concentration, v2 –Nanog protein concentration in the nucleus, v3—Nanog protein concentration in the cytoplasm; The insets in Fig 5A and 5B represent the same curves as on the main part, but with a zoomed scale of the y-axis. c-d: Time series for concentrations of pluripotent (w1) and differentiation (w2) factors. Concentration oscillations of Nanog and pluripotent/differentiation factors occurred at A = 0.2 (a, c) and A = 0.3 (b, d). The other parameters were fixed. c: The pluripotent factors w1 were suppressed and the differentiation factors w2 were expressed. This state corresponds to differentiation. d: Pluripotent factors were highly expressed, and differentiation factors were suppressed. This state corresponds to pluripotency.
Fig 6
Fig 6. The bistable switch in the core network depending on (a3, a7) parameters and at h = 6.
Highlighted region is the range of parameter values, having which the system has switch-like behavior. Furthermore, the analysis indicated that a straight line a3 = a7 divides the plane (a3, a7) it into two areas. When a3 < a7, the cell has differentiated state at all values A0. When a3 > a7, there will be some A0, that upon A > A0 the cell is pluripotent, while at A < A0 the cell will differentiate.
Fig 7
Fig 7. Steady state behavior of the PTGs and DTGs as functions of the parameter A upon h = 6, a3 = 14.5, a7 = 14.
Abscissas of the turning points of w1 and w2 curves with values A*||=0.1531 and A*|=0.2653 determine the limits of the bistable behavior (marked by asterisks). As the parameter A is boosted beyond A*|=0.2653, the core network switches to the pluripotent state, while when the external signal is dropped below A*||=0.1531, the system switches to differentiation state.
Fig 8
Fig 8. The bistable switch in the core network depending on (a3, a7) parameters and at h = 6. Highlighted region is the parameters range, for which the switch-like behavior has existed.
Furthermore, the analysis indicated that a straight line a3 = a7 in the plane (a3, a7) divides it into two areas. When a3 < a7, there will be some A0, that upon A > A0 the cell is pluripotent, while at A < A0 the cell will differentiate. When a3 > a7, the cell has pluripotent state at all values A0.

Similar articles

Cited by

References

    1. Smith A. (2017). Formative pluripotency: the executive phase in a developmental continuum. Development, 144(3), 365–373. doi: 10.1242/dev.142679 - DOI - PMC - PubMed
    1. Li M., Belmonte J. C. I. (2017). Ground rules of the pluripotency gene regulatory network. Nature Reviews Genetics. - PubMed
    1. Betschinger J. (2016). Charting developmental dissolution of pluripotency. Journal of Molecular Biology. - PubMed
    1. Makarev E., Fortney K., Litovchenko M., Braunewell K. H., Zhavoronkov A., Atala A. (2015). Quantifying signaling pathway activation to monitor the quality of induced pluripotent stem cells. Oncotarget, 6(27), 23204 doi: 10.18632/oncotarget.4673 - DOI - PMC - PubMed
    1. van den Hurk M., Kenis G., Bardy C., van den Hove D. L., Gage F. H., Steinbusch H. W., et al. (2016). Transcriptional and epigenetic mechanisms of cellular reprogramming to induced pluripotency. Epigenomics, 8(8), 1131–1149. doi: 10.2217/epi-2016-0032 - DOI - PMC - PubMed

Publication types

MeSH terms

Substances