. 2018 Jun 1;46(10):5029-5049.
doi: 10.1093/nar/gky227.

The DNA damage response activates HPV16 late gene expression at the level of RNA processing

Affiliations

The DNA damage response activates HPV16 late gene expression at the level of RNA processing

Kersti Nilsson et al. Nucleic Acids Res. .

Abstract

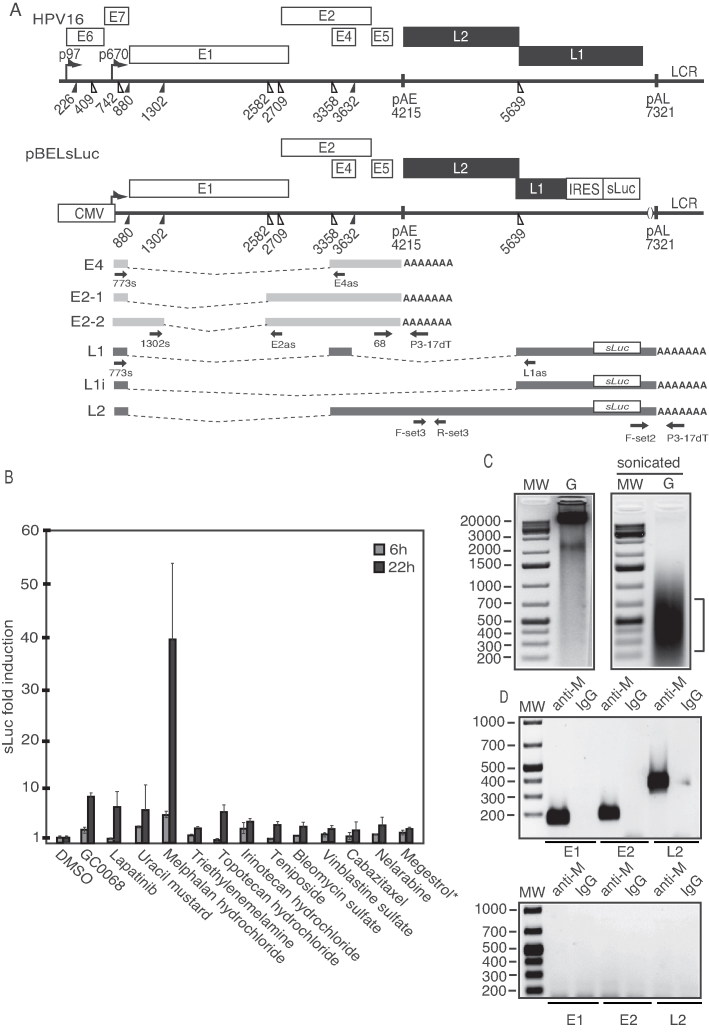
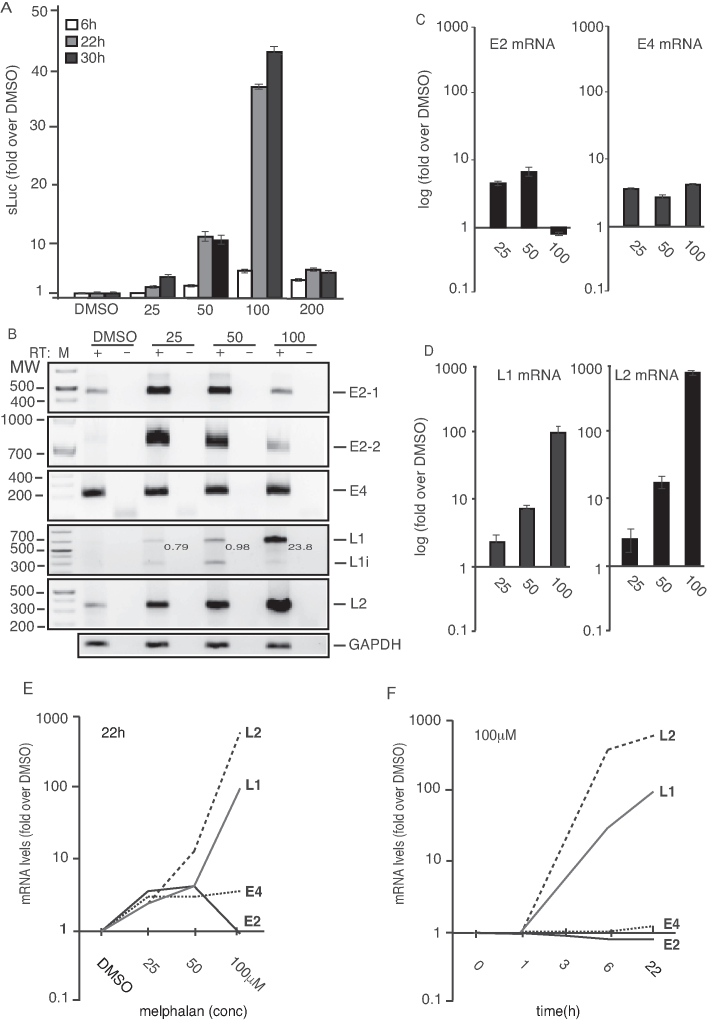
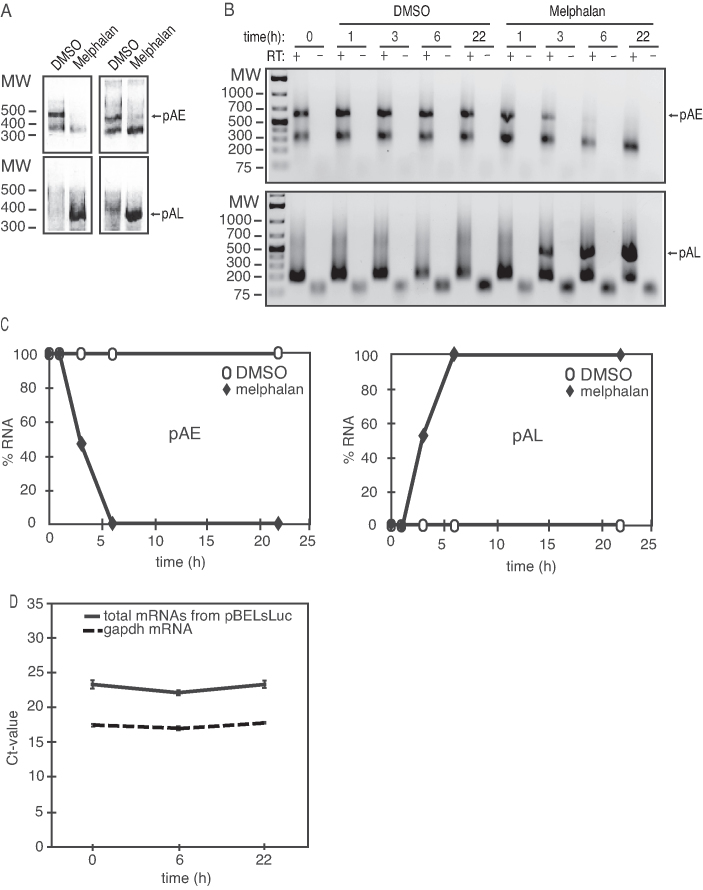
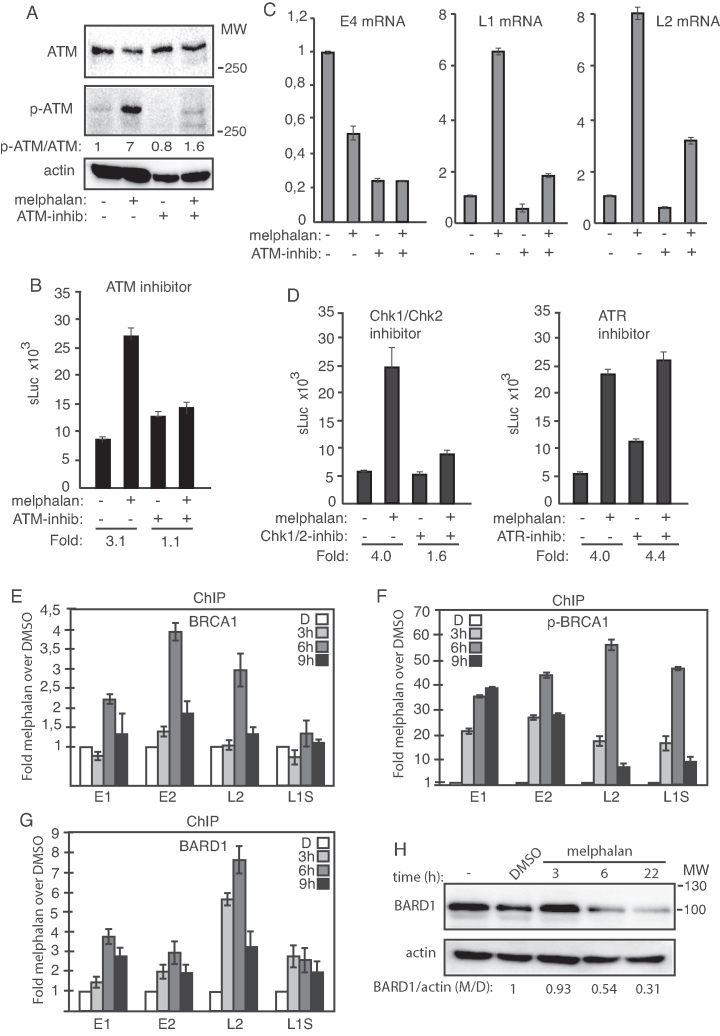
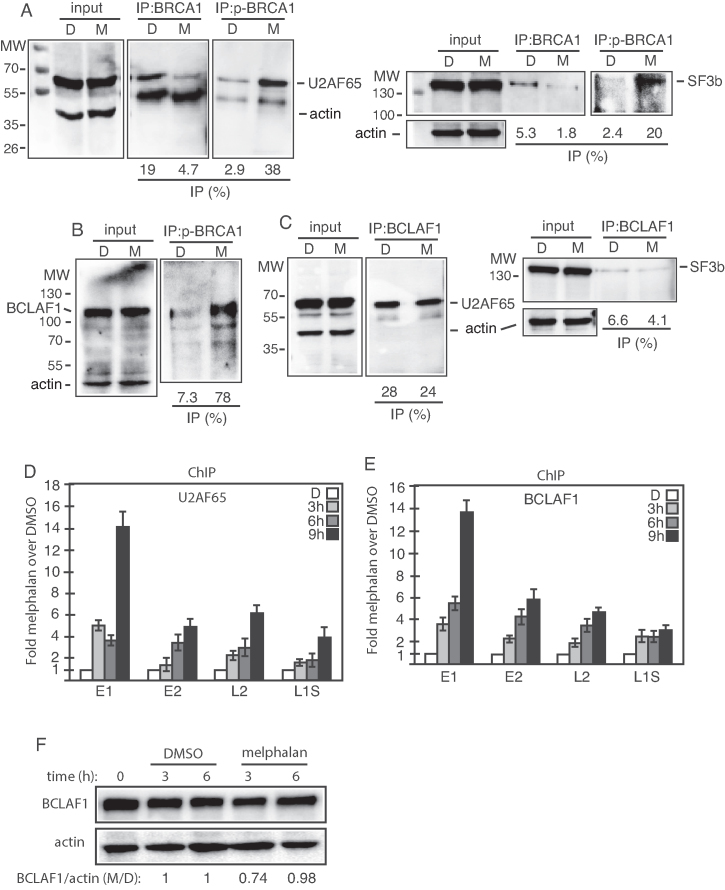
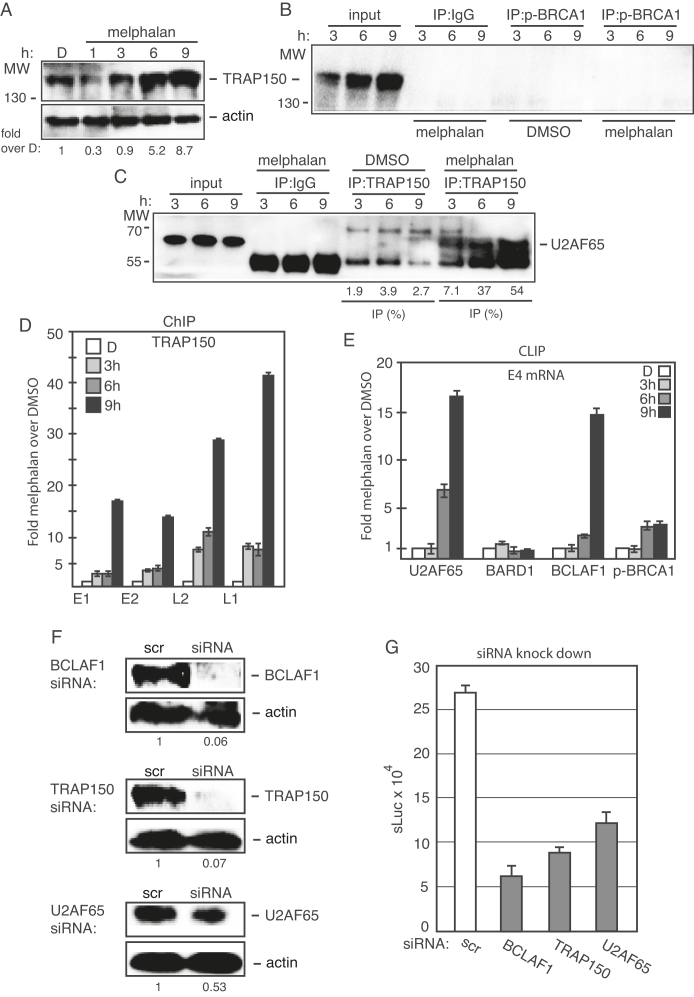
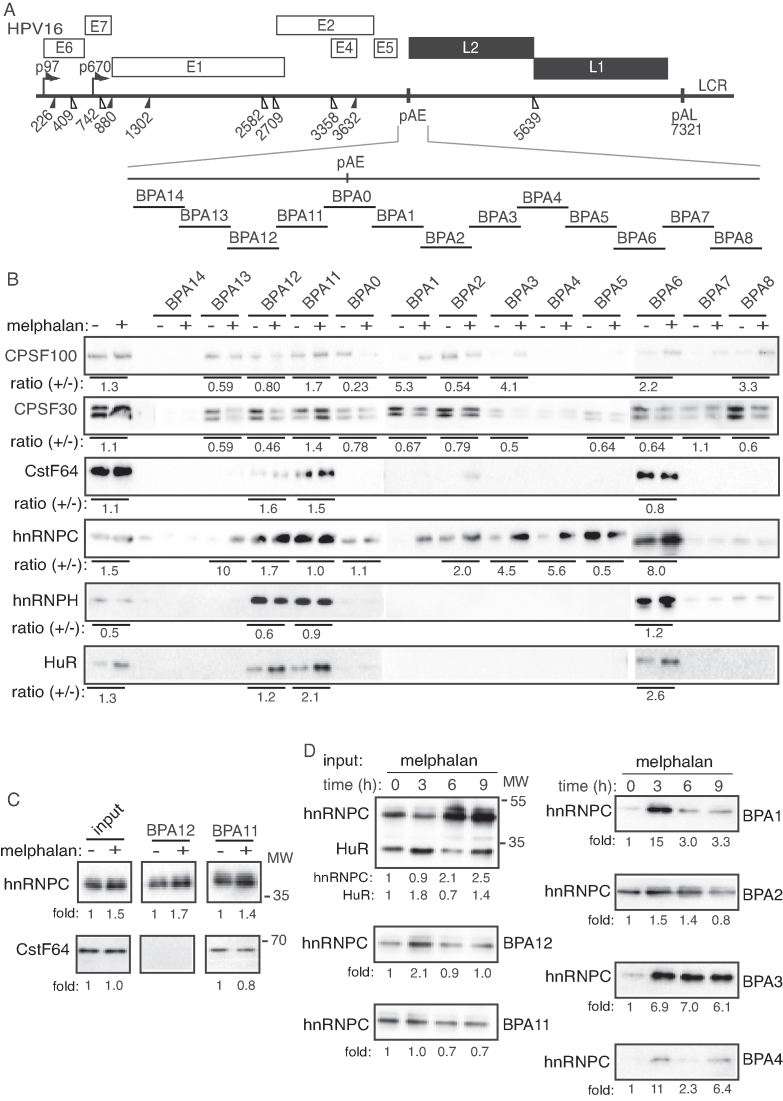
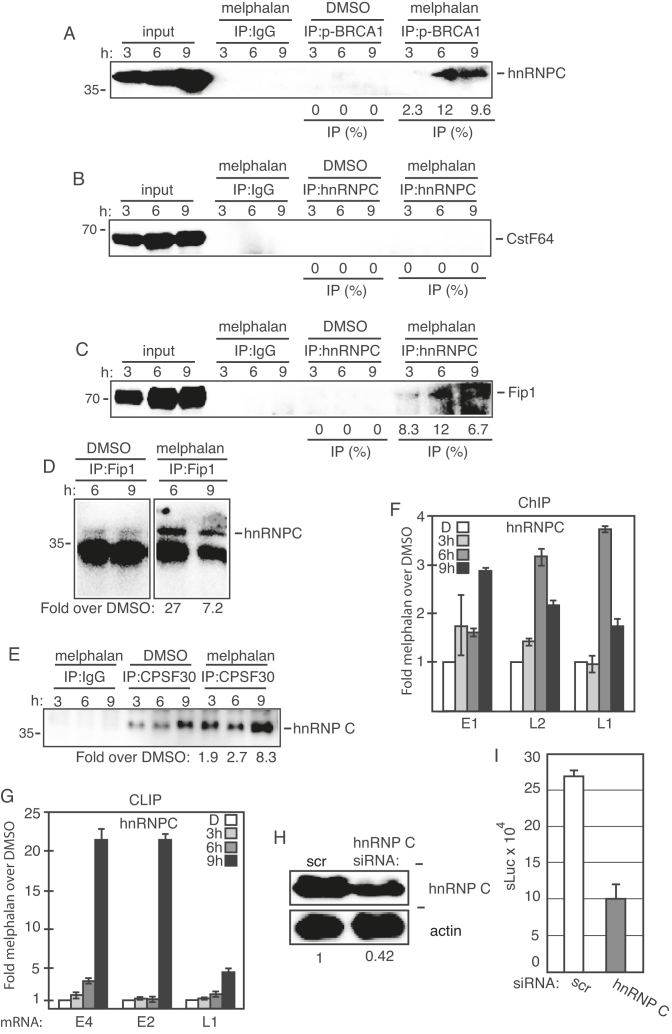
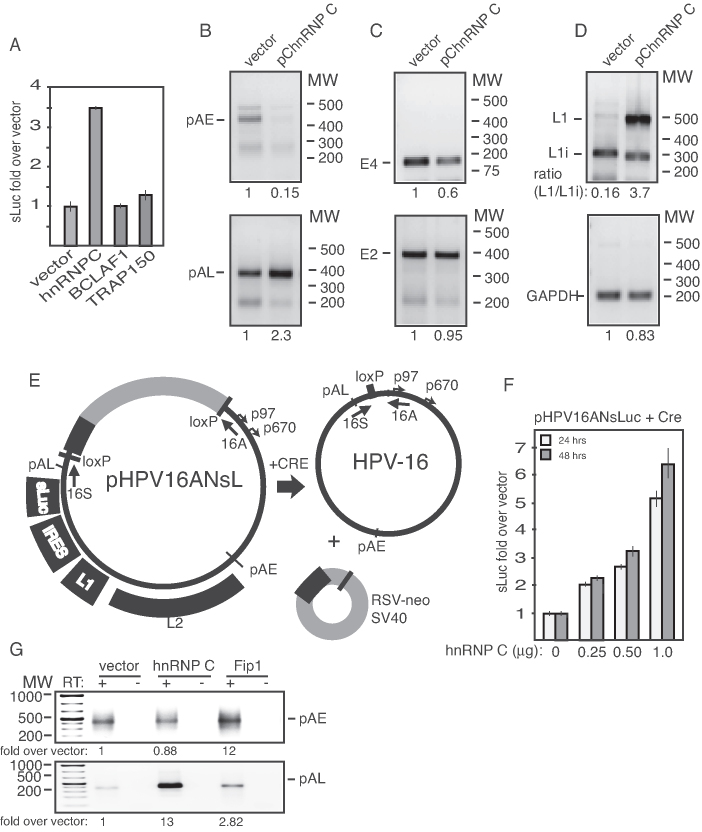
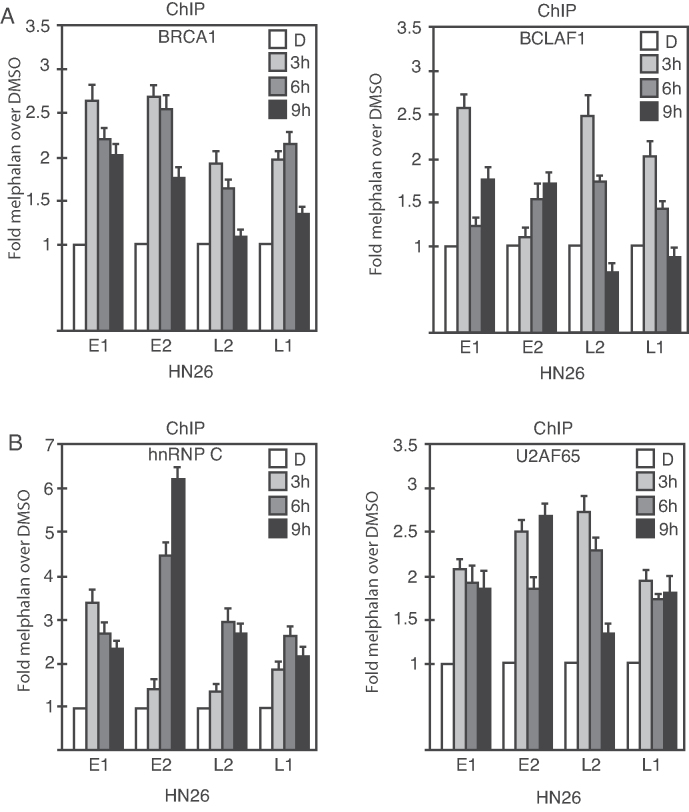
We show that the alkylating cancer drug melphalan activated the DNA damage response and induced human papillomavirus type 16 (HPV16) late gene expression in an ATM- and Chk1/2-dependent manner. Activation of HPV16 late gene expression included inhibition of the HPV16 early polyadenylation signal that resulted in read-through into the late region of HPV16. This was followed by activation of the exclusively late, HPV16 splice sites SD3632 and SA5639 and production of spliced late L1 mRNAs. Altered HPV16 mRNA processing was paralleled by increased association of phosphorylated BRCA1, BARD1, BCLAF1 and TRAP150 with HPV16 DNA, and increased association of RNA processing factors U2AF65 and hnRNP C with HPV16 mRNAs. These RNA processing factors inhibited HPV16 early polyadenylation and enhanced HPV16 late mRNA splicing, thereby activating HPV16 late gene expression.


Figures

Figure 1.
Figure 1.
(A) Schematic representation of the HPV16 genome. Rectangles represent open reading frames, promoters p97 and p670 are indicated as arrows, filled and open triangles represent 5′- and 3′-splices sites, respectively, HPV16 early and late polyA signals pAE and pAL are indicated. Below the HPV16 genome, a schematic representation of the pBELsLuc reporter plasmid stably integrated in the genome of the C33A2 cells (32,37). Transcription of the HPV16 sequences in the pBELsLuc plasmid is driven by the human cytomegalovirus promoter (CMV). The sLuc gene inserted into the L1 region is indicated and is preceded by the poliovirus 2A IRES. HPV16 E2 and E4 mRNAs mRNAs produced by C33A2 cells are indicated in light gray and HPV16 late mRNAs encoding sLuc that can be induced in this reporter cell line are indicated in black (See supplementary Table S3 for primer sequences). Arrows represent RT-PCR primers. (B) Fold induction of sLuc enzyme activity in the cell culture medium of reporter cell line C33A2 after incubation for 6 or 12 h with Akt-kinase inhibitor GDC-0068 (that has been shown previously to induce HPV16 late gene expression in C33A2 cells), or with the DNA-damaging cancer drugs lapatinib, uracil mustard, melphalan hydrochloride or triethylenemelamine. sLuc activity is displayed as fold over DMSO-treated C33A2 cells at the two time-points. *megestrol acetate. (C) Genomic DNA (G) extracted from melphalan-treated C33A2 cells before (left) and after (right) sonication. (D) PCR on sonicated DNA from C33A2 cells treated with melphalan (upper panel) or DMSO (lower panel) after immunoprecipitation of DNA with anti-melphalan antibody or IgG. Location of the PCR-primers in the HPV16 genome for amplification of the HPV16 E1, E2 and L2 regions are shown in Supplementary Figure S6 and primer sequences are listed in Supplementary Table S3.
Figure 2.
Figure 2.
(A) sLuc enzyme activity in the cell culture medium of reporter cell line C33A2 treated with various concentrations of melphalan for 6-, 22- or 30 h. sLuc activity is displayed as fold over DMSO-treated C33A2 cells at the various concentrations and time points. (B) HPV16 RT-PCR on total RNA extracted from the C33A2 reporter cell line treated with DMSO alone or 25-, 50- or 100-µM of melphalan for 22 h. The RT-PCR reactions were performed in the absence (−) or presence (+) of RT-enzyme. Note that the numbers indicated in the gel picture represent L1/L1i ratios in the various lanes. (C and D) RT-qPCR on the cDNA samples used for RT-PCR in Figure 2B. Results are displayed as fold over DMSO-treated C33A2 cells at the various concentratiosns. Note the log-scale on the y-axis. (E and F) RT-qPCR of HPV16 L1, L2, E4 and E2 mRNAs on total RNA extracted from the C33A2 reporter cell line treated with DMSO alone or various concentrations of melphalan for 22hrs (E), or with 100 µM of melphalan for various time points (F). Results are displayed as fold over DMSO-treated C33A2 cells at the various concentrations. Note the log-scale on the y-axis.
Figure 3.
Figure 3.
(A) 3′-RACE assays on total RNA extracted from C33A2 cells treated with DMSO (D) or 100 µM melphalan (M) for 22 h. The primers specifically detect mRNAs polyadenylated HPV16 pAE or HPV16 pAL. The left and right panels show 3′-RACE with two different primer pairs. (B) A 3′-RACE experiment on total RNA extracted from C33A2 cells treated with DMSO or 100 µM melphalan for various indicated time-points. The 3′-RACE reactions were performed in the absence (−) or presence (+) of RT-enzyme. pAE, mRNAs polyadenylated at HPV16 early polyadenylation signal pAE; pAL, mRNAs polyadenylated at HPV16 late polyadenylation signal pAL. (C) Quantiations of the pAE levels (left panel) or the pAL levels (right panel) shown in (C). pAE levels at 0 h of melphalan treatment were set as 100% (left panel) and pAL levels at 22 h of melphalan treatment were set as 100% (right panel). (D) Ct values of total mRNA levels produced from pBELsLuc or gapdh in C33A2 cells at different time points after addition of melphalan. Location of primers in pBELsLuc are shown in the schematic representation of pBELsLuc in Supplementary Figure S6.
Figure 4.
Figure 4.
(A) Western blots with monospecific antibodies to ATM, phosphorylated ATM or actin in C33A2 cells treated for 3 h with DMSO (−) or 100 µM melphalan (+) in the absence (−) or presence (+) of 10 µM ATM inhibitor. Ratios of phosphorylated ATM (p-ATM) over ATM are shown below the gels. Ratio of pATM over ATM in untreated cells was set as 1. (B) sLuc activity produced by C33A2 cells treated with DMSO (−) or melphalan (+) in the absence (−) or presence (+) of 10 µM ATM inhibitor KU-60019 sLuc activity was monitored 6 h after addition of melphalan to the C33A2 cells. Note that graphs display sLuc activity in the absence or presence of melphalan or melphalan in the absence or presence of kinase inhibitor. Fold induction of sLuc in the absence or presence of melphalan is shown below the graphs. (C) RT-qPCR of HPV16 E4, L1 or L2 mRNAs in total RNA extracted from the C33A2 reporter cell line treated with DMSO (−) or 100 µM melphalan (+) in the absence (−) or presence (+) of 10 µM ATM inhibitor. RNA was extracted 3 h after addition of melphalan to the C33A2 cells. (D) sLuc activity in C33A2 cells treated with DMSO (−) or 100 µM melphalan (+) in the absence (−) or presence (+) of 12.5 µM Chk1/Chk2 inhibitor AZD7762 (left panel), or in the absence (−) or presence (+) of 10 µM ATR inhibitor VE-821 (right panel). Note that graphs display sLuc activity in the absence or presence of melphalan or melphalan in the absence or presence of kinase inhibitor. Fold induction of sLuc in the absence or presence of melphalan is shown below the graphs. (EG) ChIP analyses on C33A2 cells using antibodies to proteins indicated in each histogram and qPCR of the indicated HPV16 amplicons. Mean values with standard deviations of the amount of immunoprecipitated DNA compared to input DNA are displayed. The qPCR values obtained for each primer pair with DNA extracted from DMSO-treated C33A2 cells were set to 1 to correct for differences between different ChIP extracts. Chip extracts were prepared from C33A2 cells treated with 100 µM melphalan for the indicated time-periods. All samples were analyzed in two independent ChIP assays and all qPCR reactions were performed in triplicates. (H) Western blot on BARD1 in C33A2 cells or C33A2 cells treated with DMSO or 100 µM melphalan for the indicated time points. BARD1 levels were normalized to actin and BARD1 over actin in untreated cells was set as 1.
Figure 5.
Figure 5.
(AC) Cell extracts from DMSO (D) or melphalan (M)-treated C33A2 cells were subjected to immunoprecipitation with the antibodies to BRCA1, phosphorylated BRCA1 (p-BRCA1) or BCLAF1, followed by western blotting with antibodies to U2AF65, SF3b or BCLAF1. The levels of immunoprecipitated protein and the levels of each protein in the input extracts were quantified. Percent of input protein immunoprecipitated by each antibody in extracts from in DMSO or melphalan treated cells are shown below each gel. (D and E) ChIP analyses on C33A2 cells using antibodies to proteins indicated in each histogram and qPCR of the indicated amplicons. Mean values with standard deviations of the amount of immunoprecipitated DNA compared to DNA from DMSO treated cells are displayed. Chip extracts were prepared from C33A2 cells treated with melphalan for the indicated time-periods. (F) Western blot on BCLALF1 in C33A2 cells or C33A2 cells treated with DMSO or melphalan for the indicated time points. BCLAF1 levels were normalized to actin and BCLAF1 over actin in untreated cells was set as 1.
Figure 6.
Figure 6.
(A) Western blot on TRAP150 in C33A2 cells treated with DMSO (D) or with 100 µM melphalan (M) for the indicated time periods. TRAP150 levels were normalized to actin and TRAP150 over actin in untreated cells was set as 1. (B and C) Cell extracts from DMSO or melphalan treated C33A2 cells were subjected to immunoprecipitation with the antibodies to phosphorylated BRCA1 (p-BRCA1) (B) or TRAP150 (C), followed by western blotting with antibodies to TRAP150 or U2AF65, respectively. The hours of DMSO or melphalan incubation of C33A2 cells are indicated on top of the gels. The levels of immunoprecipitated protein and the levels of each protein in the input extracts were quantified. Percent of input protein immunoprecipitated by each antibody in extracts from DMSO or melphalan-treated cells are shown below each gel. (D) ChIP analyses on C33A2 cells using antibody to TRAP150 and qPCR of the indicated HPV16 amplicons. Primers and antibodies are listed in Supplementary Tables S3 and 4, respectively, and the location in the HPV16 genome of the PCR primers is shown in Supplementary Figure S5. Mean values with standard deviations of the amount of immunoprecipitated DNA compared to DNA from DMSO-treated cells are displayed. The qPCR values obtained for each primer pair with DNA extracted from DMSO-treated C33A2 cells were set to 1 to correct for differences between different ChIP extracts. Chip extracts were prepared from C33A2 cells treated with melphalan for the indicated time-periods. (E) C33A2 cells treated with DMSO or melphalan for the indicated time points were UV irradiated and subjected to CLIP assay as detailed in ‘Materials and Methods’ section. The RNA–protein complexes were immunoprecipitated with antibodies to U2AF65, BARD1, BCLAF1 or phosphorylated BRCA1 (p-BRCA1) and the RNA extracted from the immunoprecipitated complexes were subjected to RT-PCR with primers that detect HPV16 E4 mRNAs spliced from SD880 to SA3358. (F) Western blot on extracts from C33A2 cells transfected with scrambled siRNAs (scr) or siRNAs to BCLAF1, TRAP150 or U2AF65. Protein levels were quantified in extracts prepared from cells transfected with the indicated siRNAs and divided by protein levels in extracts from cells transfected with scrambled siRNAs (scr). (G) sLuc activity produced by C33A2 cells transfected with scrambled siRNAs (scr) or siRNAs to BCLAF1, TRAP150 or U2AF65 followed by addition of 100 µM melphalan.
Figure 7.
Figure 7.
(A) Schematic drawing of the HPV16 genome with a blow-up of the region around the HPV16 early polyadenylation signal pAE. The 35-nt biotinylated ssDNA oligos (overlapping by 5-nt) used in pull down assays are indicated. (B) Western blot with antibodies to the indicated polyadenylation factors and RNA binding proteins pulled down with the indicated biotinylated oligos using cellular extracts prepared from C33A2 cells treated with DMSO (−) or melphalan (+) for 6 h. Ratios of quantified levels of the various pulled down proteins in melphalan treated cells (+) over levels of pulled down protein in DMSO-treated cells (−) are shown below the gel. (C) Western blot on pull-down with biotinylated RNA oligos. Ratios of quantified levels of hnRNP C or CstF64 pulled down in melphalan treated cells (+) over levels of pulled down proteins in DMSO-treated cells (−) are shown below the gel. (D) Western blot with antibody to hnRNP C on proteins pulled down with the biotinylated oligos using cellular extracts prepared from C33A2 cells treated with melphalan for the indicated time periods. Ratios of hnRNP C levels in melphalan treated cells at various time points over levels of pulled down hnRNP C in C33A2 cells treated for 0 h are shown below the gels.
Figure 8.
Figure 8.
(AE) Cell extracts from DMSO or melphalan-treated C33A2 cells were subjected to immunoprecipitation with the antibodies to phosphorylated BRCA1 (p-BRCA1) (A), hnRNP C (B) (C), Fip1 (D) or CPSF30 (E) followed by western blotting with antibodies to hnRNP C, CstF64 or Fip1 as indicated in the figure. The hours of DMSO or melphalan incubation of C33A2 cells are indicated on top of the gels. The levels of co-immunoprecipitated protein and the levels of each protein in the input extracts were quantified. Percent of input protein co-immunoprecipitated by each antibody in extracts from DMSO or melphalan treated cells are shown below each gel. For hnRNP C co-immunoprecipitations with anti-Fip1 or anti-CPSF30 antibody, the levels of co-immunoprecipiated hnRNP C in melphalan treated cells were divided by the levels of hnRNP C co-immunoprecipitated with anti Fip1 antibody or anti-CPSF30 in DMSO treated cells (D and E). (F) ChIP assays on DNA from C33A2 cells using antibody to hnRNP C and qPCR of the indicated HPV16 amplicons. Mean values with standard deviations of the amount of immunoprecipitated DNA compared to DNA from DMSO-treated cells are displayed. The qPCR values obtained for each primer pair with DNA extracted from DMSO-treated C33A2 cells were set to 1 to correct for differences between different ChIP extracts. Chip extracts were prepared from C33A2 cells treated with melphalan for the indicated time-periods. (G) C33A2 cells treated with DMSO or melphalan for the indicated time points were UV irradiated and subjected to CLIP assay as detailed in ‘Materials and Methods’ section. The RNA–protein complexes were immunoprecipitated with antibody to hnRNP C1 and the RNA extracted from the immunoprecipitated complexes was subjected to RT-PCR with primers that detect HPV16 E4 mRNAs spliced from SD880 to SA3358. (H) Western blot on extracts from C33A2 cells transfected with scrambled siRNAs (scr) or siRNAs to hnRNP C. hnRNP C levels were quantified in extracts prepared from cells transfected with the indicated siRNAs and divided by hnRNP C levels in extracts from cells transfected with scrambled siRNAs (scr). (I) sLuc activity produced by C33A2 cells transfected with scrambled siRNAs (scr) or siRNAs to hnRNP C followed by addition of 100 µM melphalan.
Figure 9.
Figure 9.
(A) sLuc activity induced from pBELsLuc in HeLa cells co-transfected with pBELsLuc and the indicated plasmids. (B) 3′-RACE assay on total RNA extracted from HeLa cells transfected with pBELsLuc reporter plasmid and empty vector or a plasmid expressing hnRNP C1. The primers specifically detect mRNAs polyadenylated at HPV16 pAE or HPV16 pAL. The pAE- or pAL-3′-RACE products were quantified and the levels detected in cells transfected with hnRNP C plasmid were divided by the levels detected in cells transfected with empty plasmid (vector). The ratios are indicated below the gels. (C) RT-PCR on HPV16 E4 mRNAs or L1 and L1i mRNAs (D) produced from pBELsLuc transiently transfected into HeLa cells in the presence of empty vector or plasmid expressing hnRNP C1. The RT-PCR products were quantified and the levels detected in cells transfected with hnRNP C plasmid were divided by the levels detected in cells transfected with empty plasmid (vector). In case of the L1 mRNAs, the ratios between the L1 and L1i splice variants of the L1 mRNAs in cells transfected with hnRNP C plasmid or empty plasmid (vector) are shown. The ratios are indicated below the gels. GAP, GAPDH mRNAs. (E) Schematic representation of genomic HPV16 plasmid pHPV16ANSL (32,59). LoxP sites and HPV16 early (p97) and late (p670) promoters and early (pAE) and late (pAL) poly(A) signals are indicated. The effect of the cre recombinase on these plasmids is illustrated (59). (F) sLuc activity produced in HeLa cells transfected with pHPV16ANSL in the absence or presence of various concentrations of hnRNP C-expression plasmid. (G) 3′-RACE assay on total RNA extracted from HeLa cells transfected with pHPV16ANSL and empty vector or hnRNP C1- or Fip1- expression plasmid. The 3′-RACE primers specifically detect mRNAs polyadenylated at HPV16 pAE or HPV16 pAL. The pAE- or pAL-3′-RACE products were quantified and the levels detected in cells transfected with hnRNP C plasmid or Fip1 plasmid were divided by the levels detected in cells transfected with empty plasmid (vector). The ratios are indicated below the gels.
Figure 10.
Figure 10.
(A) RT-qPCR for CPSF30 mRNA on total RNA extracted from C33A2, C33A6 or the parental C33A cells transfected with siRNAs to CPSF30 compared to the same cell lines transfected with scrambled siRNAs (scr). (B) sLuc activity induced by transfection of C33A2 and C33A6 cells with siRNAs to CPSF30 compared to cells transfected with scrambled siRNAs (scr). (C) Western blotting for influenza virus NS1 protein on extracts from C33A cells transfected with expression plasmids for influenza A virus H5N1 or H1N1–1918 NS1 protein. (D) sLuc activity at various time points after transfection of C33A2 and C33A6 cells with empty vector or expression plasmid for influenza A virus H1N1–1918 NS1 protein. (E) CAT protein levels produced from HPV16 subgenomic reporter plasmid pBELCAT (see Supplementary Figure S6B) transfected with plasmid pH5N1Gs that produces an influenza virus H5N1 NS1 protein that binds CPSF30, or with plasmid pH5N1Hn that produces an influenza virus H5N1 NS1 protein that cannot bind CPSF30. (F) Western blot for H5N1 NS1 protein in the same cell extracts that were analysed for CAT protein levels in (E).
Figure 11.
Figure 11.
ChIP analyses on HPV16-positive tonsillar cancer cell line HN26 that contains episomal HPV16 DNA (unpublished results). Melphalan treated HN26 cells were subjected to ChIP analysis using antibodies to DDR factors BRCA1 and BLAF1 (A) and RNA binding proteins U2A65 and hnRNP C (B). Primers and antibodies are listed in Supplementary Tables S3 and 4, respectively, and the location in the HPV16 genome of the PCR primers is shown in Supplementary Figure S5. Mean values with standard deviations of the amount of immunoprecipitated DNA compared to DNA from DMSO-treated cells are displayed. The q-PCR values obtained for each primer pair with DNA extracted from DMSO-treated HN26 cells were set to 1 to correct for differences between different ChIP extracts. Chip extracts were prepared from C33A2 cells treated with melphalan for the indicated time-periods.

Similar articles

Cited by

References

    1. Chow L.T., Broker T.R., Steinberg B.M.. The natural history of human papillomavirus infections of the mucosal epithelia. APMIS. 2010; 118:422–449. - PubMed
    1. Schiffman M., Doorbar J., Wentzensen N., de Sanjose S., Fakhry C., Monk B.J., Stanley M.A., Franceschi S.. Carcinogenic human papillomavirus infection. Nat. Rev. Dis. Primers. 2016; 2:16086. - PubMed
    1. Bouvard V., Baan R., Straif K., Grosse Y., Secretan B., El Ghissassi F., Benbrahim-Tallaa L., Guha N., Freeman C., Galichet L. et al. . A review of human carcinogens–Part B: biological agents. Lancet Oncol. 2009; 10:321–322. - PubMed
    1. Walboomers J.M., Jacobs M.V., Manos M.M., Bosch F.X., Kummer J.A., Shah K.V., Snijders P.J., Peto J., Meijer C.J., Munoz N.. Human papillomavirus is a necessary cause of invasive cervical cancer worldwide. J. Pathol. 1999; 189:12–19. - PubMed
    1. Kajitani N., Satsuka A., Kawate A., Sakai H.. Productive lifecycle of human papillomaviruses that depends upon squamous epithelial differentiation. Front. Microbiol. 2012; 3:152. - PMC - PubMed

Publication types

MeSH terms