. 2018 Jun 20;46(11):5822-5836.
doi: 10.1093/nar/gky225.

The loss of SMG1 causes defects in quality control pathways in Physcomitrella patens

Affiliations

The loss of SMG1 causes defects in quality control pathways in Physcomitrella patens

James P B Lloyd et al. Nucleic Acids Res. .

Abstract

Nonsense-mediated mRNA decay (NMD) is important for RNA quality control and gene regulation in eukaryotes. NMD targets aberrant transcripts for decay and also directly influences the abundance of non-aberrant transcripts. In animals, the SMG1 kinase plays an essential role in NMD by phosphorylating the core NMD factor UPF1. Despite SMG1 being ubiquitous throughout the plant kingdom, little is known about its function, probably because SMG1 is atypically absent from the genome of the model plant, Arabidopsis thaliana. By combining our previously established SMG1 knockout in moss with transcriptome-wide analysis, we reveal the range of processes involving SMG1 in plants. Machine learning assisted analysis suggests that 32% of multi-isoform genes produce NMD-targeted transcripts and that splice junctions downstream of a stop codon act as the major determinant of NMD targeting. Furthermore, we suggest that SMG1 is involved in other quality control pathways, affecting DNA repair and the unfolded protein response, in addition to its role in mRNA quality control. Consistent with this, smg1 plants have increased susceptibility to DNA damage, but increased tolerance to unfolded protein inducing agents. The potential involvement of SMG1 in RNA, DNA and protein quality control has major implications for the study of these processes in plants.


Figures

Figure 1.
Figure 1.
Analysis of differential expression from smg1 mutant plants. (A) Outline of the analysis pipeline to find differential gene expression and differential alternative splicing in the smg1 mutant plants. (B and C) Genes up-regulated and down-regulated, respectively, in smg1Δ lines when compared to WT (P < 0.05). Three different tools were used to assess if a transcript was up- or down-regulated (DESeq, edgeR and NOISeq). During the first round of selection, only genes that were differentially regulated in at least two tools were taken forward (overlap is indicated with an asterisk).
Figure 2.
Figure 2.
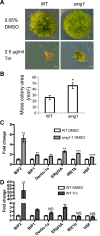
smg1 plants are partially resistant to the unfolded protein inducing drug tunicamycin (Tm). (A) Three week old plants grown on Tm or solvent control (DMSO). Scale bar is 1 mm. (B) Moss colony size on Tm (2.5 μg/ml). n = 5–12. Asterisks represent a statistically significant difference from WT using an unpaired t test P < 0.05. A significant drug/genotype interaction was identified (Aligned Rank Transform test; P = 4.14 × 10⁻⁵), along with a significant drug treatment (Aligned Rank Transform test; P = 7.25 × 10⁻¹¹) and genotype (Aligned Rank Transform test; P = 7.02 × 10⁻⁵) effect. (C) qRT-PCR analysis of BiP1 (Pp1s181_3V6), BiP2 (Pp1s288_23V6), Derlin-1a (Pp1s213_66V6), ERjd3A (Pp1s368_19V6), IRE1b (Pp1s34_189V6) and HSF (Pp1s31_388V6), expression in WT and smg1Δ line 1 (DMSO treated as solvent control). (D) qRT-PCR analysis of BiP1 (Pp1s181_3V6), BiP2 (Pp1s288_23V6), Derlin-1a (Pp1s213_66V6), ERjd3A (Pp1s368_19V6), IRE1b (Pp1s34_189V6), and HSF (Pp1s31_388V6), expression in WT treated with Tm (1 μg/ml) or untreated (DMSO solvent control). The fold change indicates the amount of target expression normalized to that of PpEF1α and relative to WT levels. Error bars represent the standard error of the mean from three biological replicates. Asterisks indicate conditions with a statistically significant difference from WT (DMSO solvent control) using an unpaired t test (*P < 0.05; **P < 0.01; ***P < 0.001; ****P < 0.0001). WT DMSO control in panel C and D represent the same data.
Figure 3.
Figure 3.
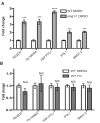
NMD targets are not increased in Tm exposed plants. (A) The expression of NMD targets RS2Z37 (Pp1s69_23V6), Pp108464 (Pp1s270_54V6), HSF Pp1s31_388V6eIF5L1 (Pp1s626_4V6), and SMG7-2 (Pp1s311_73V6) in the smg1 mutant plants treated with DMSO as a solvent control. (B) The expression of NMD targets RS2Z37 (Pp1s69_23V6), Pp108464 (Pp1s270_54V6), HSF (Pp1s31_388V6), eIF5L1 (Pp1s626_4V6), and SMG7-2 (Pp1s311_73V6) in WT plants exposed to two weeks of Tm (1 μg/ml). WT DMSO control in panel A and B represent the same data. The fold change indicates the amount of target expression normalized to that of PpEF1α and relative to WT levels. Error bars represent the standard error of the mean from three biological replicates. Asterisks indicate conditions with a statistically significant difference from WT (DMSO solvent control) using an unpaired t test (*P < 0.05; **P < 0.01; ***P < 0.001; ****P < 0.0001).
Figure 4.
Figure 4.
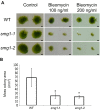
smg1 lines are more susceptible than WT to bleomycin. (A) Two week old moss plants grown on media with or without bleomycin. Two representative colonies of each line are shown for each treatment. Scale bar is 1 mm. (B) Moss colony size after three weeks growth on 100 ng/ml bleomycin. Data is the mean from 6–12 plants. Error bars represent standard deviation. Asterisks indicate lines with a statistically significant difference from the WT using an unpaired t test P < 0.05.
Figure 5.
Figure 5.
Transcript attributes influencing NMD target identification. (A) Factors that influenced NMD target status. The plot quantifies how well transcript attributes distinguish between NMD-targeted and non-NMD targeted events/transcripts in the ensemble machine learning approach. Transcript attributes act as either positive (red) or negative (purple) predictors of NMD-targeted status. Transcript attributes are located above the relevant feature of the example transcript models (bottom), with the exception of transcript-wide features (fold change (log2), retained intron, motif: CTACAAGA and alterative donor site), located on the right of the plot. Example transcript models represent two transcript isoforms, one non-NMD target (top) and one NMD target (bottom). Transcript attributes are ranked by ‘median importance’: Importance is the relative predictive power of each transcript attribute in identifying NMD-targeted events/transcripts. The median importance is taken from across the various machine learning tools used in this study. Abbreviations used in plot: TSS is transcriptional start site, CDS is coding sequence, and UTR is untranslated region. (B) The frequency of different AS types with increased, decreased or unchanged alternative splicing after the loss of SMG1. The AS types included: Included exon (retained exon; n = 2260), skipped exon (n = 829), retained intron (n = 58 459), spliced intron (n = 4636), alternative acceptor site (n = 5106), and alternative donor site (n = 4110). The frequency of exitrons (n = 18901) and other retained introns (n = 39 558) after loss of SMG1. Exitrons are defined as retained introns that are within a coding region and do not introduce a PTC. More differential exitrons have increased than differential retained introns (Fisher's exact test one-tailed test, P = 0.0056).
Figure 6.
Figure 6.
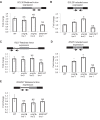
Isoforms with PTCs introduced by a retained intron do not have increased steady state expression in smg1 mutants. (A) qRT-PCR analysis of the PpSCL30 (Pp1s183_39V6) retained intron PTC+ variant. (B) qRT-PCR analysis of the PpSCL30 (Pp1s183_39V6) included exon PTC+ variant. (C) qRT-PCR analysis of the PpRS27 (Pp1s173_12V6) retained intron PTC+ variant. (D) qRT-PCR analysis of the PpRS27 (Pp1s173_12V6) included exon PTC+ variant. (E) qRT-PCR analysis of the PpRS2Z37 (Pp1s69_23V6) retained intron PTC+ variant. (A–E) The fold change indicates the amount of target expression normalized to that of PpEF1α and relative to WT levels. Error bars represent the standard error of the mean from three biological replicates. Asterisks indicate conditions with a statistically significant difference from WT using an unpaired t test (*P < 0.05; **P < 0.01; ***P < 0.001; ****P < 0.0001). NS, not significantly different. The black boxes represent constitutive exons, grey boxes represent alternative exons and black lines represent unspliced introns. Light grey lines represent introduced PTCs. Change in expression PpRS2Z37 (Pp1s69_23V6) alternative acceptor site PTC+ variant was already reported (29).
Figure 7.
Figure 7.
SMG1 is important for multiple quality control pathways in moss. SMG1 activates the NMD pathway, which leads to repression of PTC-containing transcripts. We suggest that SMG1, potentially acting via NMD, represses the unfolded protein response, and activates the DNA repair machinery.

Similar articles

Cited by

References

    1. Mühlemann O. Recognition of nonsense mRNA: towards a unified model. Biochem. Soc. Trans. 2008; 36:497–501. - PubMed
    1. He F., Li X., Spatrick P., Casillo R., Dong S., Jacobson A.. Genome-wide analysis of mRNAs regulated by the nonsense-mediated and 5′ to 3′ mRNA decay pathways in yeast. Mol. Cell. 2003; 12:1439–1452. - PubMed
    1. Mendell J.T., Sharifi N.A., Meyers J.L., Martinez-Murillo F., Dietz H.C.. Nonsense surveillance regulates expression of diverse classes of mammalian transcripts and mutes genomic noise. Nat. Genet. 2004; 36:1073–1078. - PubMed
    1. Rehwinkel J., Letunic I., Raes J., Bork P., Izaurralde E.. Nonsense-mediated mRNA decay factors act in concert to regulate common mRNA targets. RNA. 2005; 11:1530–1544. - PMC - PubMed
    1. Guan Q., Zheng W., Tang S., Liu X., Zinkel R.A., Tsui K.-W., Yandell B.S., Culbertson M.R.. Impact of nonsense-mediated mRNA decay on the global expression profile of budding yeast. PLoS Genet. 2006; 2:e203. - PMC - PubMed

Publication types