. 2018 Jul;53(7):548-559.
doi: 10.1002/jms.4085.

Differential mobility spectrometry (DMS) reveals the elevation of urinary acetylcarnitine in non-human primates (NHPs) exposed to radiation

Affiliations

Differential mobility spectrometry (DMS) reveals the elevation of urinary acetylcarnitine in non-human primates (NHPs) exposed to radiation

Nicholas B Vera et al. J Mass Spectrom. 2018 Jul.

Abstract

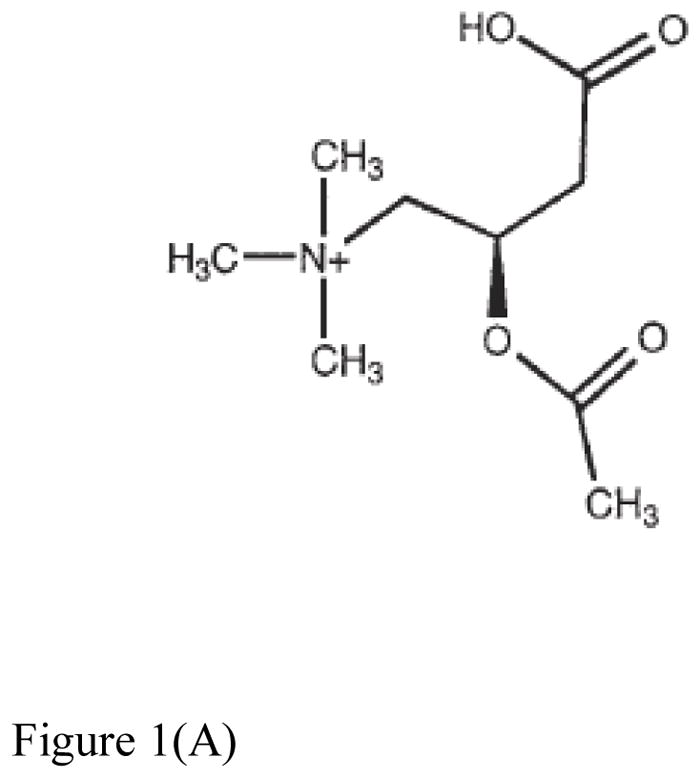
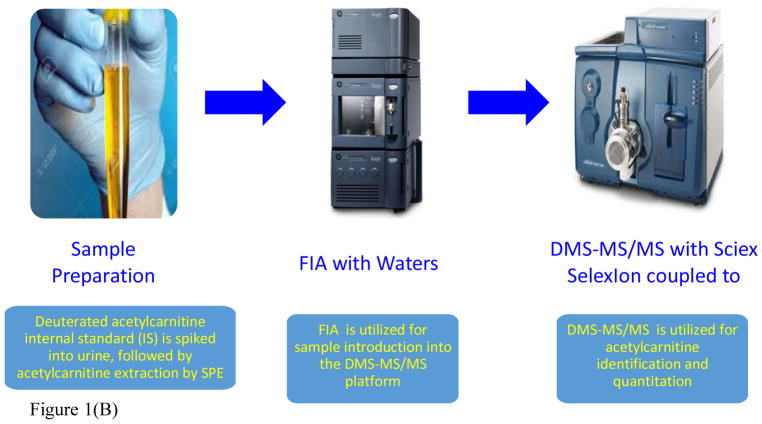
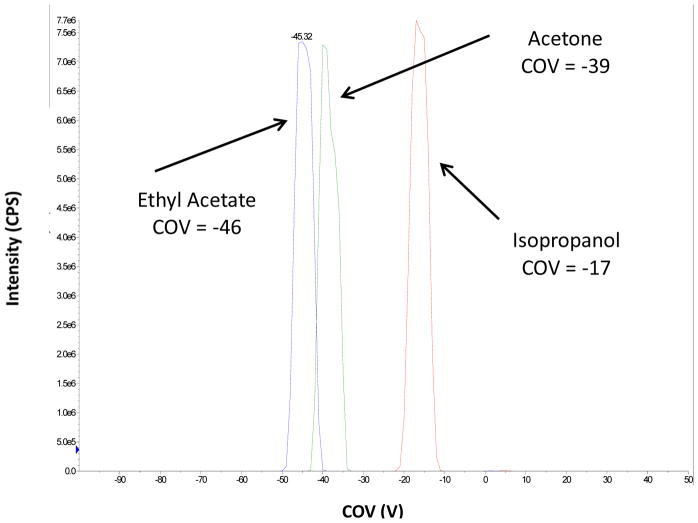
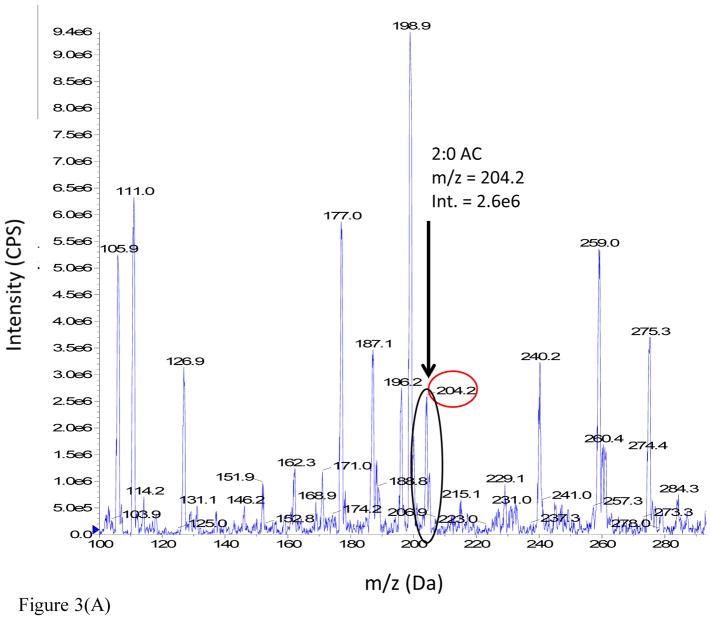
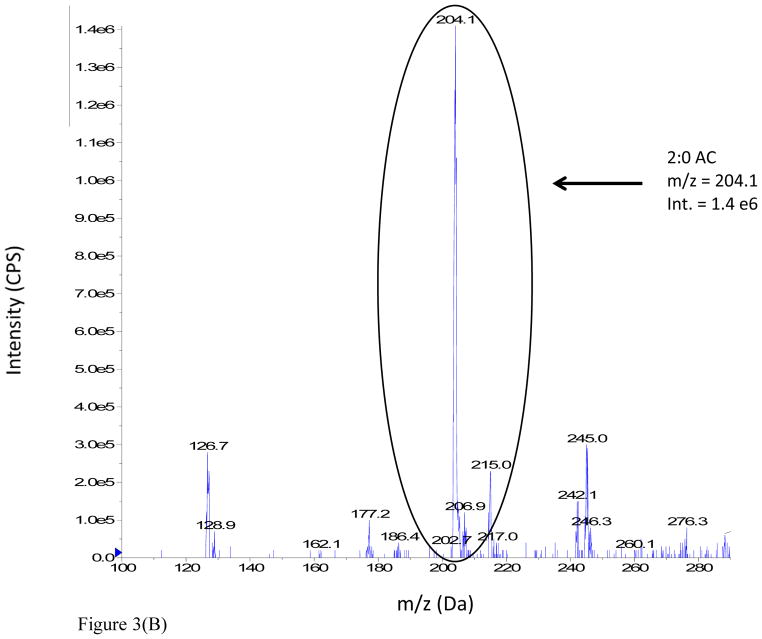
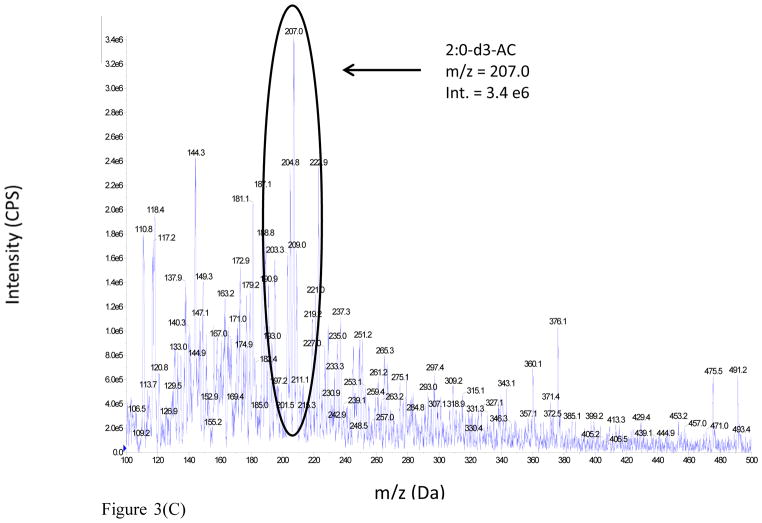
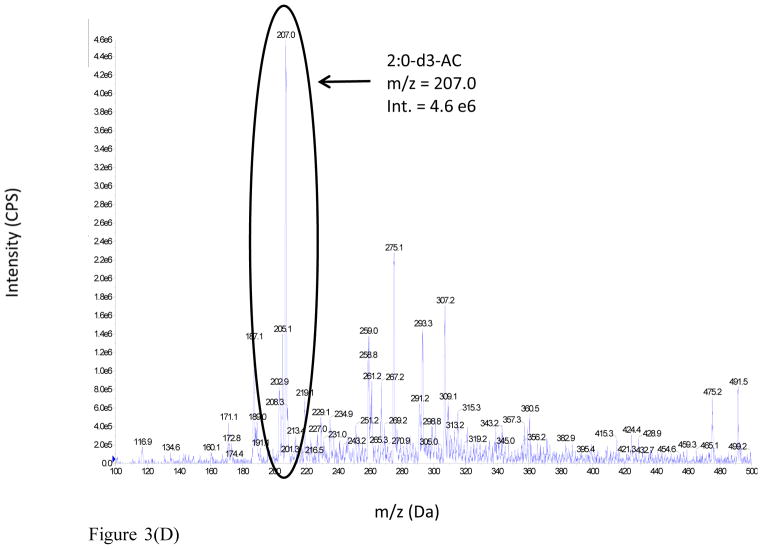
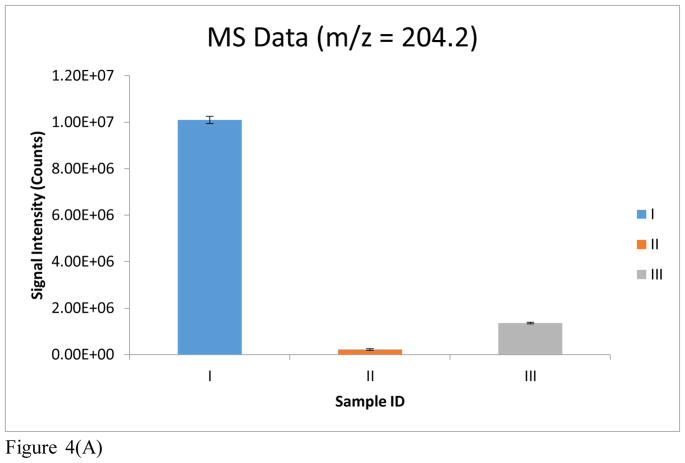
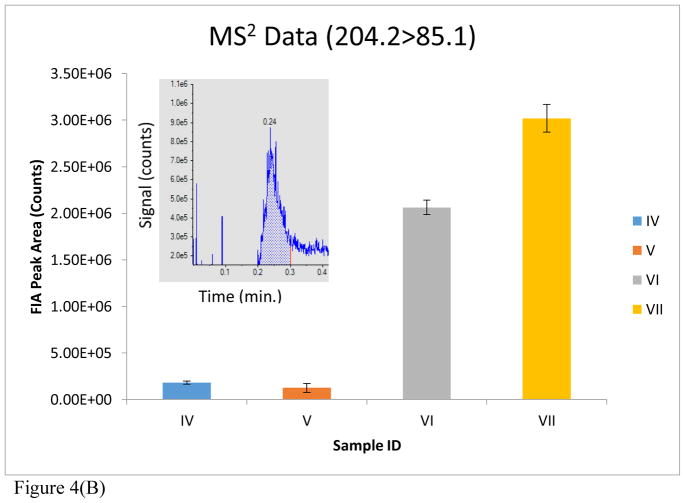
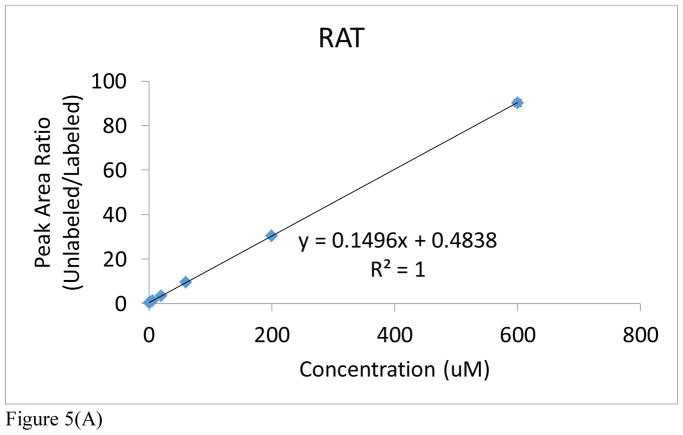
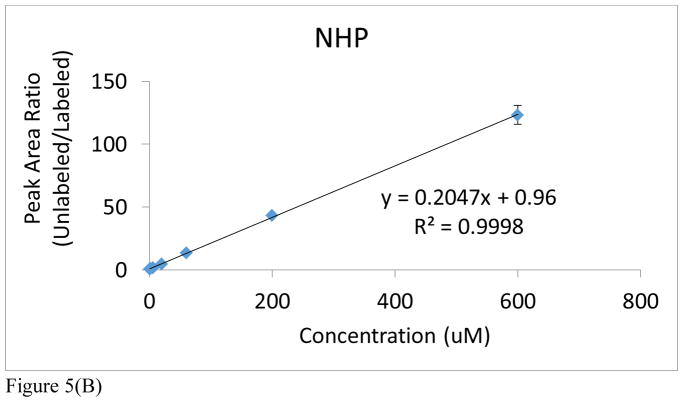
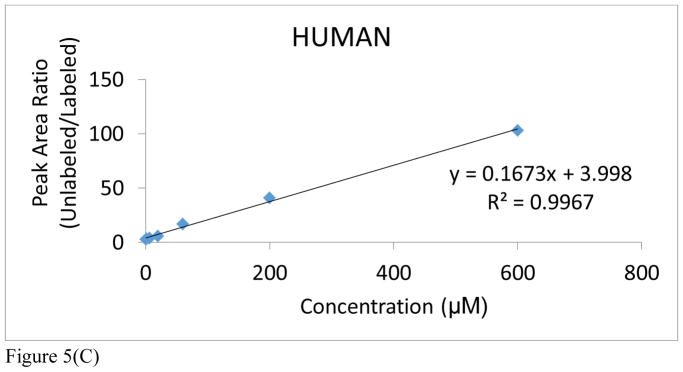
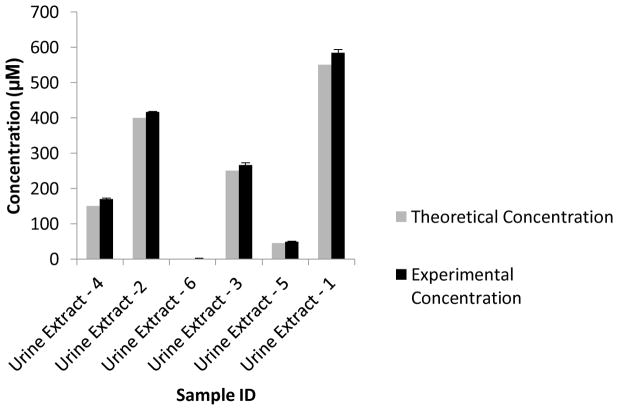
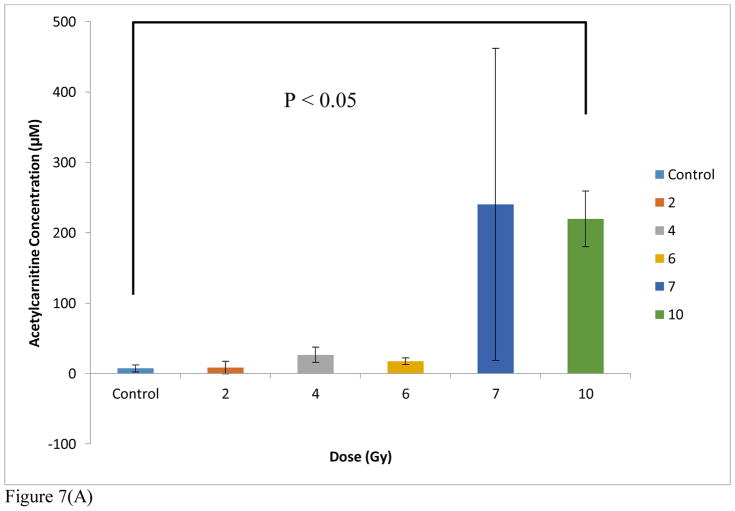
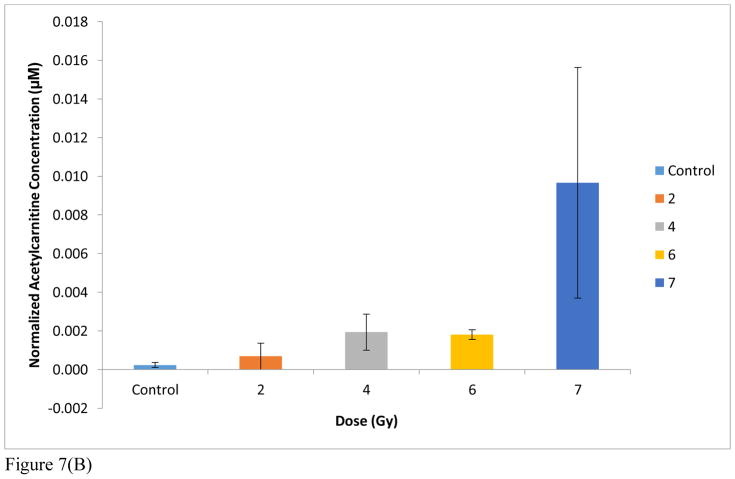
Acetylcarnitine has been identified as one of several urinary biomarkers indicative of radiation exposure in adult rhesus macaque monkeys (non-human primates, NHPs). Previous work has demonstrated an up-regulated dose-response profile in a balanced male/female NHP cohort. As a contribution toward the development of metabolomics-based radiation biodosimetry in human populations and other applications of acetylcarnitine screening, we have developed a quantitative, high-throughput method for the analysis of acetylcarnitine. We employed the Sciex SelexIon DMS-MS/MS QTRAP 5500 platform coupled to flow injection analysis (FIA), thereby allowing for fast analysis times of less than 0.5 minutes per injection with no chromatographic separation. Ethyl acetate is used as a DMS modifier to reduce matrix chemical background. We have measured NHP urinary acetylcarnitine from the male cohorts that were exposed to the following radiation levels: control, 2, 4, 6, 7, and 10 Gy. Biological variability, along with calibration accuracy of the FIA-DMS-MS/MS method, indicates LOQ of 20 μM, with observed biological levels on the order of 600 μM and control levels near 10 μM. There is an apparent onset of intensified response in the transition from 6 to 10 Gy. The results demonstrate that FIA-DMS-MS/MS is a rapid, quantitative technique that can be utilized for the analysis of urinary biomarker levels for radiation biodosimetry.

Keywords: Acetylcarnitine; Compensation voltage; Creatinine; Differential mobility spectometry; Flow injection analysis; Radiation biodosimetry; Separation voltage.


Figures

Figure 1
Figure 1
Figure 1(A). Structure of acetylcarnitine. Figure 1(B). Assay workflow for the analysis of NHP urinary acetyl-L-carnitine by FIA-DMS-MS/MS. DMS-MS/MS allowed for the reduction of chemical background, along with a reduced run time of less than 0.5minutes.
Figure 1
Figure 1
Figure 1(A). Structure of acetylcarnitine. Figure 1(B). Assay workflow for the analysis of NHP urinary acetyl-L-carnitine by FIA-DMS-MS/MS. DMS-MS/MS allowed for the reduction of chemical background, along with a reduced run time of less than 0.5minutes.
Figure 2
Figure 2
Various DMS modifiers were investigated, including isopropanol, ethyl acetate and acetone. The optimal DMS MOD COV values for 20 μM acetylcarnitine solubilized in methanol:water:formic acid (70:30:0.1, v/v/v) are highlighted.
Figure 3
Figure 3
Figure 3(A). Full scan mass spectrum of 100 μM acetylcarnitine spiked into male SD rat urine: MS Scan, DMS Off, with no DMS field applied. Figure 3(B). Full scan mass spectrum of 100 μM acetylcarnitine spiked into male SD rat urine: MS Scan, DMS On. Figure 3(C). Full scan mass spectrum of 100 μM deuterated acetylcarnitine IS spiked into male SD rat urine: MS Scan, DMS Off, with no DMS field applied. Figure 3(D). Full scan mass spectrum of 100 μM deuterated acetylcarnitine IS spiked into male SD rat urine: MS Scan, DMS On.
Figure 3
Figure 3
Figure 3(A). Full scan mass spectrum of 100 μM acetylcarnitine spiked into male SD rat urine: MS Scan, DMS Off, with no DMS field applied. Figure 3(B). Full scan mass spectrum of 100 μM acetylcarnitine spiked into male SD rat urine: MS Scan, DMS On. Figure 3(C). Full scan mass spectrum of 100 μM deuterated acetylcarnitine IS spiked into male SD rat urine: MS Scan, DMS Off, with no DMS field applied. Figure 3(D). Full scan mass spectrum of 100 μM deuterated acetylcarnitine IS spiked into male SD rat urine: MS Scan, DMS On.
Figure 4
Figure 4
Figure 4(A). MS data reported for the following samples: (I) Blank rat urine extract, MS scan (m/z = 204.2), DMS off; (II) Blank rat urine extract, MS scan (m/z = 204.2), DMS on; (III) Rat urine extract with 100 μM acetylcarnitine spiked in, MS scan (m/z = 204.2), DMS on. Figure 4(B). MS2 data reported for the following samples: (IV) Blank rat urine extract, MS2 (204.2>85.1), DMS off; (V) Blank rat urine extract, MS2 (204.2>85.1), DMS on; (VI) Rat urine extract with 100 μM acetylcarnitine spiked in, MS2 (204.2>85.1), DMS off; (VII) Rat urine extract with 100 μM acetylcarnitine spiked in, MS2 (204.2>85.1), DMS on. MS data and MS2 data demonstrate a reduction of chemical background in SD rat urine through the utilization of DMS. MS2 data demonstrates a clear enhancement of acetylcarnitine signal intensity through the utilization of DMS. The error bars represent the standard error of the mean (SEM) for each technical replicate. An FIA distribution (signal vs. time) of the MS2 experiment (204.2>85.1) is also shown in (B) for sample (VII).
Figure 4
Figure 4
Figure 4(A). MS data reported for the following samples: (I) Blank rat urine extract, MS scan (m/z = 204.2), DMS off; (II) Blank rat urine extract, MS scan (m/z = 204.2), DMS on; (III) Rat urine extract with 100 μM acetylcarnitine spiked in, MS scan (m/z = 204.2), DMS on. Figure 4(B). MS2 data reported for the following samples: (IV) Blank rat urine extract, MS2 (204.2>85.1), DMS off; (V) Blank rat urine extract, MS2 (204.2>85.1), DMS on; (VI) Rat urine extract with 100 μM acetylcarnitine spiked in, MS2 (204.2>85.1), DMS off; (VII) Rat urine extract with 100 μM acetylcarnitine spiked in, MS2 (204.2>85.1), DMS on. MS data and MS2 data demonstrate a reduction of chemical background in SD rat urine through the utilization of DMS. MS2 data demonstrates a clear enhancement of acetylcarnitine signal intensity through the utilization of DMS. The error bars represent the standard error of the mean (SEM) for each technical replicate. An FIA distribution (signal vs. time) of the MS2 experiment (204.2>85.1) is also shown in (B) for sample (VII).
Figure 5
Figure 5
Figure 5(A). Acetylcarnitine calibration curve spiked into rat urine. Figure 5(B). Acetylcarnitine calibration curve spiked into NHP urine. Figure 5(C). Acetylcarnitine calibration curve spiked into human urine. Peak area ratios (analyte/IS) are reported for each calibration curve point, with the IS concentration = 6 μM. The average of each calibration curve replicate, along with the standard error of the mean (SEM), have been calculated (see Supplemental Information). The slope and intercept values, along with their uncertainties, are also reported (uncertainties found in parentheses). Calibration curves from all species were linear across 3 orders of magnitude (0.6–600 μM).
Figure 5
Figure 5
Figure 5(A). Acetylcarnitine calibration curve spiked into rat urine. Figure 5(B). Acetylcarnitine calibration curve spiked into NHP urine. Figure 5(C). Acetylcarnitine calibration curve spiked into human urine. Peak area ratios (analyte/IS) are reported for each calibration curve point, with the IS concentration = 6 μM. The average of each calibration curve replicate, along with the standard error of the mean (SEM), have been calculated (see Supplemental Information). The slope and intercept values, along with their uncertainties, are also reported (uncertainties found in parentheses). Calibration curves from all species were linear across 3 orders of magnitude (0.6–600 μM).
Figure 6
Figure 6
Blind DMS-MS/MS urine analysis of male SD rat urine spiked with varying concentrations of acetylcarnitine. Experimental concentrations of urinary acetylcarnitine are compared to their known theoretical concentrations. The experimental concentration error bars represent the standard error of the mean (SEM) for each technical replicate.
Figure 7
Figure 7
Figure 7(A). DMS-MS/MS analysis of urinary acetylcarnitine from healthy male NHPs exposed to levels of radiation from 0 Gy (control) to 10 Gy quantified using a NHP-urine acetylcarnitine calibration curve, with the IS concentration = 6 μM. Creatinine normalization was not done. Significance was determined using Welch’s t-test. Figure 7(B). NHP urinary acetylcarnitine normalized to corresponding creatinine data. No creatinine data was available for the 10 Gy exposed cohort. The error bars represent the standard error of the mean (SEM) of three biological replicates
Figure 7
Figure 7
Figure 7(A). DMS-MS/MS analysis of urinary acetylcarnitine from healthy male NHPs exposed to levels of radiation from 0 Gy (control) to 10 Gy quantified using a NHP-urine acetylcarnitine calibration curve, with the IS concentration = 6 μM. Creatinine normalization was not done. Significance was determined using Welch’s t-test. Figure 7(B). NHP urinary acetylcarnitine normalized to corresponding creatinine data. No creatinine data was available for the 10 Gy exposed cohort. The error bars represent the standard error of the mean (SEM) of three biological replicates

Similar articles

Cited by

References

    1. Pannkuk EL, Laiakis EC, Authier S, Wong K, Fornace AJ., Jr Global metabolomic identification of long-term dose-dependent urinary biomarkers in nonhuman primates exposed to ionizing radiation. Radiat Res. 2015;184:121–133. - PMC - PubMed
    1. Laiakis EC, Mak TD, Anizan S, Amundson SA, Barker CA, Wolden SL, Brenner DJ, Fornace AJ., Jr Development of a metabolomic radiation signature in urine from patients undergoing total body irradiation. Radiat Res. 2014;181:350–361. - PMC - PubMed
    1. Lin Y, Sun Z. Current views on type 2 diabetes. J Endocrinol. 2010;204:1–11. - PMC - PubMed
    1. Yoon HR. Screening newborns for metabolic disorders based on targeted metabolomics using tandem mass spectrometry. Ann Pediatr Endocrinol Metab. 2015;20:119–124. - PMC - PubMed
    1. Hoppel C. The role of carnitine in normal and altered fatty acid metabolism. Am J Kidney Dis. 2003;41:S4–12. - PubMed

LinkOut - more resources