. 2018 Mar 28;6(3):271-281.e7.
doi: 10.1016/j.cels.2018.03.002.

Scalable Open Science Approach for Mutation Calling of Tumor Exomes Using Multiple Genomic Pipelines

Collaborators, Affiliations

Scalable Open Science Approach for Mutation Calling of Tumor Exomes Using Multiple Genomic Pipelines

Kyle Ellrott et al. Cell Syst. .

Abstract

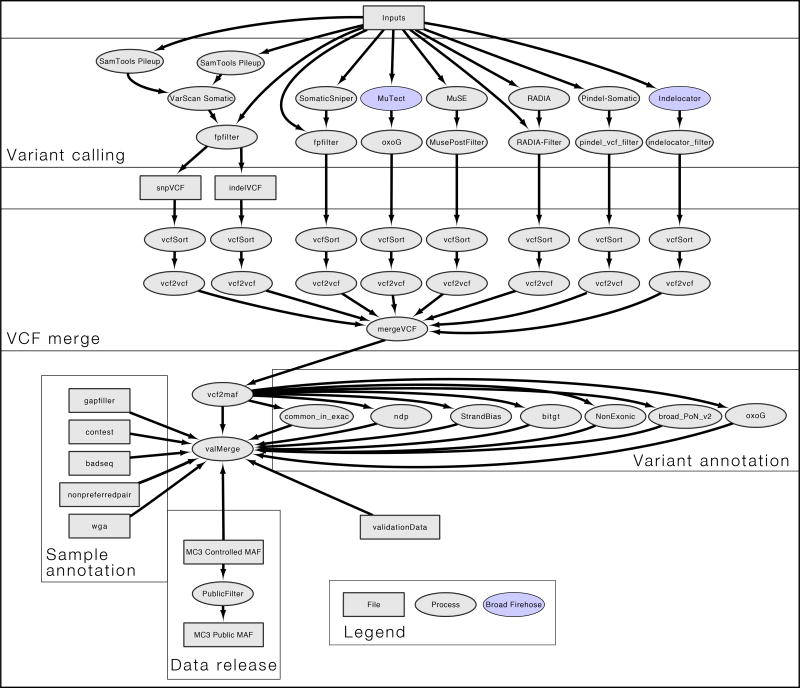
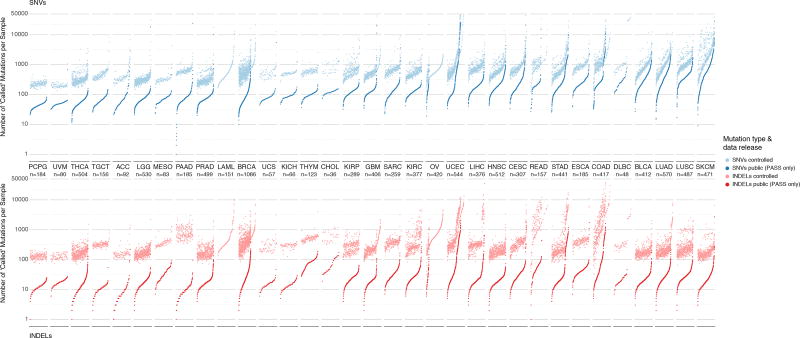
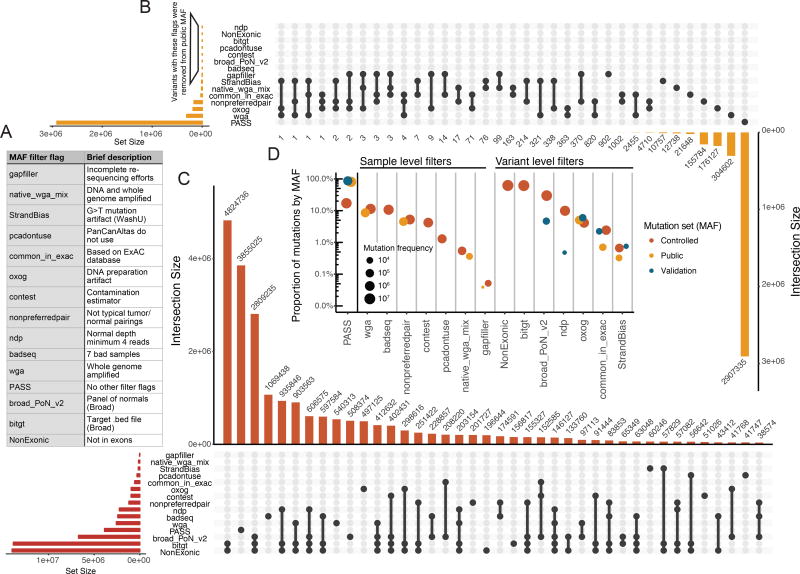
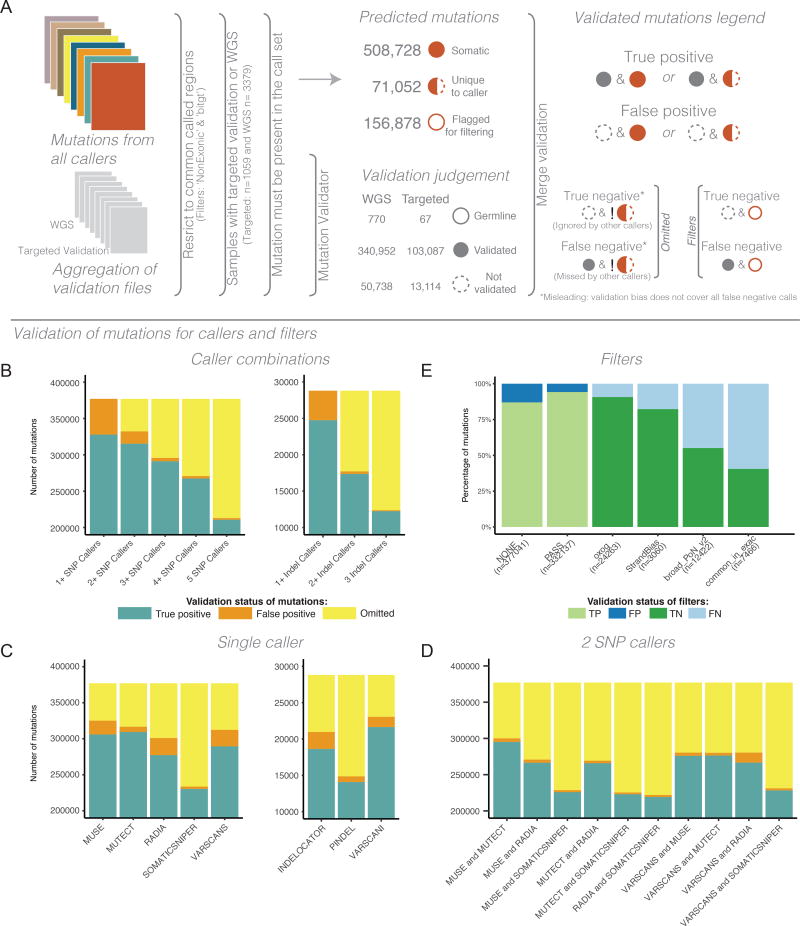
The Cancer Genome Atlas (TCGA) cancer genomics dataset includes over 10,000 tumor-normal exome pairs across 33 different cancer types, in total >400 TB of raw data files requiring analysis. Here we describe the Multi-Center Mutation Calling in Multiple Cancers project, our effort to generate a comprehensive encyclopedia of somatic mutation calls for the TCGA data to enable robust cross-tumor-type analyses. Our approach accounts for variance and batch effects introduced by the rapid advancement of DNA extraction, hybridization-capture, sequencing, and analysis methods over time. We present best practices for applying an ensemble of seven mutation-calling algorithms with scoring and artifact filtering. The dataset created by this analysis includes 3.5 million somatic variants and forms the basis for PanCan Atlas papers. The results have been made available to the research community along with the methods used to generate them. This project is the result of collaboration from a number of institutes and demonstrates how team science drives extremely large genomics projects.

Keywords: PanCanAtlas project; TCGA; large-scale; open science; pan-cancer; reproducible computing; somatic mutation calling.


Figures

Figure 1
Figure 1. Workflow for mutation detection and filtering
This workflow diagram reflects the internal design of the mutation calling pipeline. Squares in the flowchart represent files, and circles indicate processes. When colored, analysis was performed using the BROAD Firehose pipeline. Aligned input files were analyzed by 7 different variant callers using author recommended parameters to generate VCF files. All VCF files were merged and VEP annotated using vcf2maf tool. Processes flanking vcf2maf processes illustrate when filters were integrated. Finally, a separate set of annotation files were included and considered for variant and sample selection in the controlled and the public release of the annotated mutations file.
Figure 2
Figure 2. Distribution of mutations in controlled and open-access mutation files
Two panels show mutation load for each sample in the dataset for SNVs (above) and indels (below). Each dot of the sorted scatter plots shows the total number of mutations pre- and post-filtering per sample. Total mutation counts are separated by total number SNVs (blue) and indels (red) per samples. Lighter colors indicate pre-filtered mutations from the controlled-access MAF, and deeper colors indicate post-filtered (PASS only) mutations from the open-access MAF. Cancers are ordered by the median number of post-filtered SNVs per tissue. Furthermore, samples are sorted by increasing number of total mutation count for SNV and indel plots respectively. Samples removed during post-filtering are also shown i.e. LAML and OV in lighter colors without an accompanying pair and are sorted accordingly. The total number of samples for each cancer type is displayed under each cancer label. Finally, Y-axis limits were placed from 0–50,000 for clarity. This resulted in the removal of 14 hypermutator samples from SNV plot and 10 hypermutator samples from the indel plot.
Figure 3
Figure 3. Description of the filters implemented in controlled and open-access mutation files
A) Filter flags (as displayed in MAF) and a brief description of their purpose. B) Variant counts in the open-access MAF by filter were processed using an UpSetR plot(Conway et al., 2017). The following filters were globally applied to the Open-access MAF: ‘ndp’, ‘NonExonic’, ‘bitgt’, ‘pcadontuse’, ‘contest’, ‘broad_PoN_v2’, and ‘badseq’. Thus, zero variants in the open-acess MAF were annotated with these flags. The inverted bar chart allows for the interpretation co-occurring filters at the variant level. For example, 304,602 variants were labeled with ‘wga’ alone, whereas, 2,455 variants were annotated with both ‘wga’ and ‘common_in_exac’. The connected dots indicate which of filter flags are assessed. C) UpSetR plot indicates the co-occurrence of filters with variants of the controlled MAF (same as B). D) The proportion and frequency of filters for both the open and controlled datasets are displayed. Additionally, validation flag counts and proportions are shown. The set of validation calls has a higher percentage of PASS calls, reflecting its bias toward higher quality variant calls. Filter flags are separated into samples level filters and variant level filters. See also Figure S4.
Figure 4
Figure 4. Validation statistics of mutations calls
While these results reflect validation of resequenced samples, technical artifacts may still be present because orthogonal technology was not implemented. A) Overview of the Mutations validation process. Symbols are used to illustrate how mutations predictions were assessed. Values shown in under ‘Predicted mutations’ are not mutually exclusive. Exclamation marks under ‘True negative’ and ‘False negative’ denotes the logical negation or not. B) The composition of variants with overlapping callers. Starting with any caller and increasing to require more callers to agree on a site. This is done for both SNVs (left) and indels (right). C) The composition of validation status for calls from each independent caller for both SNPs (left) and indels (right). D) The composition of validation status for pairs of callers. Panels B, C, and D all have a truncated y-axis, all values below indicate true positives mutation status. Omitted, as illustrated in panel A, reflects the limitations of assessing mutation predictions when validations does incorporate all possible events. E) The composition of validation status for each of the filter flags. See also Figure S3. See also Figure 3 and Tables S2 and S3.
Figure 5
Figure 5. Intersection of mutation calls across variant prediction software
The top bar-plot indicates intersection size. More specifically, one or more tools called each variant. This plot provides the number of variants that are uniquely called by one tool (a single point) or the numbers of variants called by many tools (2 or more points). The bottom left plot indicates the set size. The linked points below display the intersecting sets of interest or which tools called variants. A) PASS only mutations from the controlled MAF are shown. B) Tools designed to call indels are displayed in a similar fashion to plot A. Only indels with greater than 3 supporting reads are displayed in this plot. Additionally, two samples were removed from these plots that represent extreme hypermutators (TCGA-D8-A27V, and TCGA-EW-A2FV).

References

    1. Akbani R, Akdemir KC, Aksoy BA, Albert M, Ally A, Amin SB, Arachchi H, Arora A, Auman JT, Ayala B, et al. Genomic Classification of Cutaneous Melanoma. Cell. 2015;161:1681–1696. - PMC - PubMed
    1. Aken BL, Ayling S, Barrell D, Clarke L, Curwen V, Fairley S, Fernandez Banet J, Billis K, García Girón C, Hourlier T, et al. The Ensembl gene annotation system. Database. 2016;2016 baw093. - PMC - PubMed
    1. Barretina J, Caponigro G, Stransky N, Venkatesan K, Margolin AA, Kim S, Wilson CJ, Lehár J, Kryukov GV, Sonkin D, et al. The Cancer Cell Line Encyclopedia enables predictive modelling of anticancer drug sensitivity. Nature. 2012;483:603–607. - PMC - PubMed
    1. Brunner AM, Graubert TA. Genomics in childhood acute myeloid leukemia comes of age. Nat. Med. 2018;24:7–9. - PubMed
    1. Campbell PJ, Getz G, Stuart JM, Korbel JO, Stein LD Net, - ICGC/TCGA Pan-Cancer Analysis of Whole Genomes. Pan-cancer analysis of whole genomes. bioRxiv 162784 2017

Publication types