. 2018 Mar 28;6(3):282-300.e2.
doi: 10.1016/j.cels.2018.03.003.

Pan-cancer Alterations of the MYC Oncogene and Its Proximal Network across the Cancer Genome Atlas

Collaborators, Affiliations

Pan-cancer Alterations of the MYC Oncogene and Its Proximal Network across the Cancer Genome Atlas

Franz X Schaub et al. Cell Syst. .

Abstract

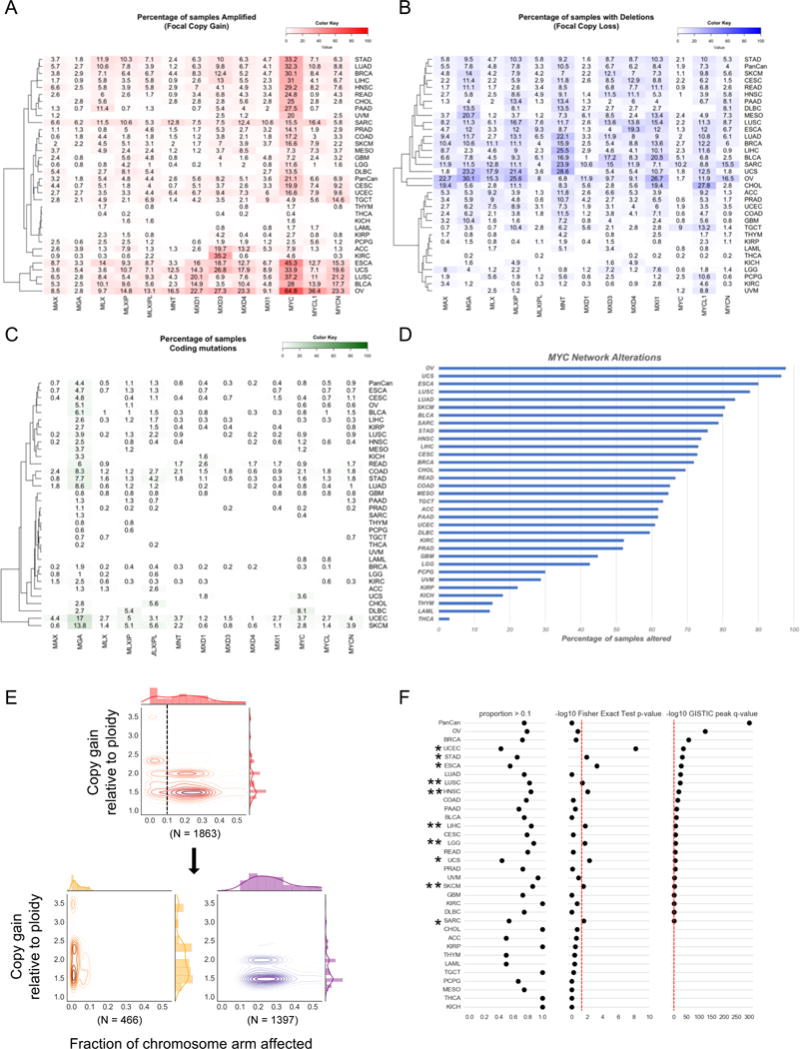
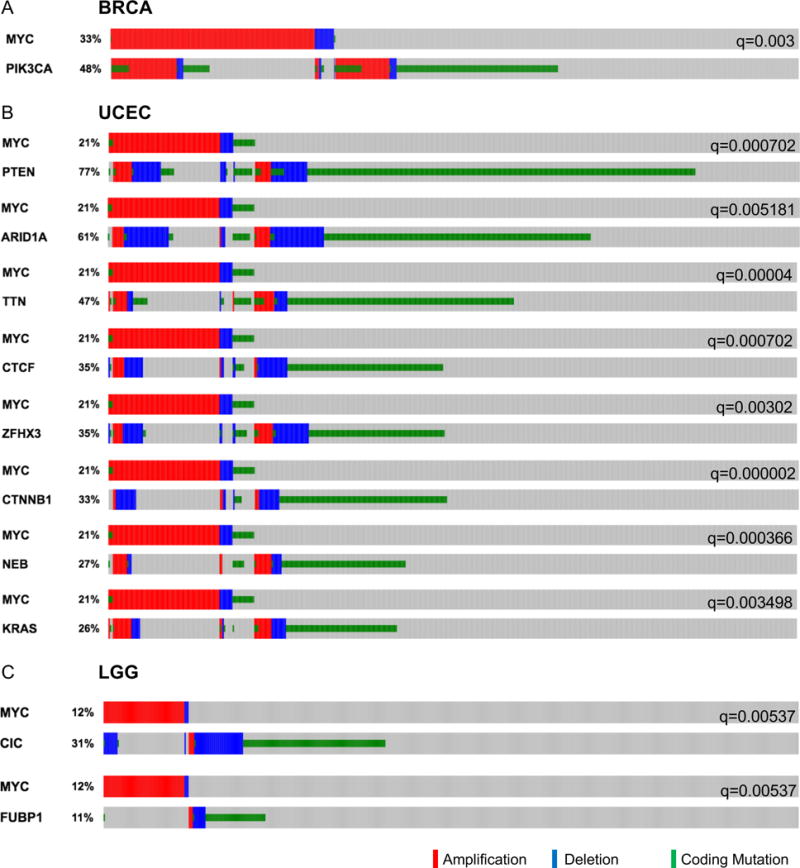
Although the MYC oncogene has been implicated in cancer, a systematic assessment of alterations of MYC, related transcription factors, and co-regulatory proteins, forming the proximal MYC network (PMN), across human cancers is lacking. Using computational approaches, we define genomic and proteomic features associated with MYC and the PMN across the 33 cancers of The Cancer Genome Atlas. Pan-cancer, 28% of all samples had at least one of the MYC paralogs amplified. In contrast, the MYC antagonists MGA and MNT were the most frequently mutated or deleted members, proposing a role as tumor suppressors. MYC alterations were mutually exclusive with PIK3CA, PTEN, APC, or BRAF alterations, suggesting that MYC is a distinct oncogenic driver. Expression analysis revealed MYC-associated pathways in tumor subtypes, such as immune response and growth factor signaling; chromatin, translation, and DNA replication/repair were conserved pan-cancer. This analysis reveals insights into MYC biology and is a reference for biomarkers and therapeutics for cancers with alterations of MYC or the PMN.

Keywords: MAX; MNT; MYC genomic alterations; TCGA; The Cancer Genome Atlas.


Figures

Figure 1
Figure 1
Proximal MYC Network. (A) Percentage of samples across 33 tumor-types with focal range copy number amplifications (leftmost box, red), focal range deletions (middle box, blue), and coding mutations (rightmost box, green) per gene of the MYC network. (B) Oncoprint for focal amplifications of MYC, MYCN and MYCL (C, D) Focal amplifications (C, red) and focal deletions (D, blue) across genes in the proximal MYC network visualized by the distribution of alteration size and amplitude. Oncogenes and tumor suppressors outside of the MYC network (denoted by *) were included for reference.
Figure 2
Figure 2
Tumor type specific alterations of PMN members. (A) Percentage of samples with focal amplifications per gene per tumor-type. (B) Percentage of samples with focal deletions respectively per gene per tumor-type. (C) Percentage of samples with protein coding mutations per gene per tumor-type. (D) Percentage of samples showing any alterations in at least one of the PMN members per tumor-type. (E) Focal amplification of MYC visualized by the distribution of alteration size and amplitude. An arbitrary threshold of 0.1 was used to define two groups with either amplification larger than a 0.1 fraction of the chromosome arm, or less than 0.1. (F) Diagram of various metrics calculated for focal copy number amplifications targeting MYC. Proportion > 0.1 (left) demonstrates the amount of samples for a given tumor type with focal amplifications that span greater than a 0.1 fraction of the chromosome arm. The Fisher’s Exact Test p-value metric (middle) resulted from Fisher’s Exact Tests comparing the fractions of samples on either side of the 0.1 cutoff for each tumor type to the rest of the tumor types, with the red line representing the equivalent of p=0.05. The GISTIC peak q-value (right) is only available for tumor types in which GISTIC identified significant regions of focal copy number amplification affecting MYC, with the red line representing the equivalent of q=1.00.
Figure 3
Figure 3
Pan-cancer mutual exclusivity with focal copy number events and mutations of MYC. (A) Oncoprint of MYC with 4 most mutually exclusively altered genes PTEN, BRAF, APC, and PIK3CA. (B) Table lists top 4 genes most mutually exclusive with respect to MYC. Columns 2–5 show counts of samples with no alterations in MYC or the gene, with just the gene altered, with just MYC altered, and with both MYC and the gene altered. Columns 6 and 7 show p-values and q-values as computed by the DISCOVER method. (C) Box plots compare MYC expression between groups of samples defined by pairwise alteration status of PTEN, BRAF, APC, and PIK3CA respectively with MYC. Hedges’ g effect sizes are indicated for each pair of boxplots. ‘NS’ indicates an effect size magnitude < 0.2(negligible), ‘*’ indicates an effect size magnitude <0.5(small), ‘**’ indicates an effect size magnitude <0.8(medium), and ‘***’ indicates an effect size magnitude >=0.8(large).
Figure 4
Figure 4
Cancer type specific mutual exclusivity with MYC. (A) - (C) Oncoprints and tables listing genes significantly mutually exclusive with MYC within BRCA, UCEC (top 8 genes are shown), and LGG respectively. Columns 2–5 in the tables show counts of samples with no alterations in MYC or the gene, with just the gene altered, with just MYC altered, and with both MYC and the gene altered. Columns 6 and 7 show p-values and q-values as computed by the DISCOVER method. A false discovery rate of <= 1% was used to indicate statistical significance.
Figure 5
Figure 5
MYC Expression. (A)-(C) Comparison of MYC, MYCN, and MYCL expressions respectively between cohorts defined by focal amplification state of the genes themselves. For each of the three genes, from left to right, the box plots represent - cohort with any PMN gene other than MYC, MYCN, MYCL altered respectively, cohort with MYC, MYCN, or MYCL amplified respectively, and cohort with no PMN genes altered. (D) Distribution of MYC and MYCN gene expression per tumor type. (F) Distribution of MYC protein expression per tumor type. (E) Correlation between median MYC mRNA expression and median MYC protein expression per tumor-type.
Figure 6
Figure 6
Pan-cancer gene set enrichment patterns. (A) Heatmap shows clustering of tumor-types based on top 100 most positively correlated gene sets from GO Molecular Function category for MYC (A) and MYCN (B). Each cell of the heatmap is colored by the Normalized Enrichment Score of a gene set for a tumor-type. Gray cells indicate lack of enrichment. Dots below tumor type denote high MYC amplification, while plus signs denote high mRNA expression. Blue lines on the heat maps mark gene sets corresponding to the canonical MYC signature, orange lines correspond to the non-canonical MYC signature, and yellow lines correspond to neuronal function, found in MYCN only. Tables contain main gene sets found in each cluster category. One asterisk marks a WNT signaling gene set, and two asterisks mark a metabolic gene set.
Figure 7
Figure 7
Heatmap of correlation (Spearman Rho value) between miRNA and MYC expression across the 33 cancer studies. Only miRNAs that showed an absolute correlation value equal or greater than 0.35 in at least three studies were included (the complete list is provided as Table S9). Red indicates positive correlation, blue negative correlation.

Similar articles

Cited by

References

    1. Adhikary S, Marinoni F, Hock A, Hulleman E, Popov N, Beier R, Bernard S, Quarto M, Capra M, Goettig S, et al. The ubiquitin ligase HectH9 regulates transcriptional activation by Myc and is essential for tumor cell proliferation. Cell. 2005;123:409–421. - PubMed
    1. Ayer DE, Kretzner L, Eisenman RN. Mad: a heterodimeric partner for Max that antagonizes Myc transcriptional activity. Cell. 1993;72:211–222. - PubMed
    1. Bahram F, von der Lehr N, Cetinkaya C, Larsson LG. c-Myc hot spot mutations in lymphomas result in inefficient ubiquitination and decreased proteasome-mediated turnover. Blood. 2000;95:2104–2110. - PubMed
    1. Bartel DP. MicroRNAs: genomics, biogenesis, mechanism, and function. Cell. 2004;116:281–297. - PubMed
    1. Bazarov AV, Adachi S, Li SF, Mateyak MK, Wei S, Sedivy JM. A modest reduction in c-myc expression has minimal effects on cell growth and apoptosis but dramatically reduces susceptibility to Ras and Raf transformation. Cancer Res. 2001;61:1178–1186. - PubMed

Publication types

MeSH terms

Substances