. 2018 Mar 28;15(4):616.
doi: 10.3390/ijerph15040616.

The Epidemiology of Unintentional and Violence-Related Injury Morbidity and Mortality among Children and Adolescents in the United States

Affiliations

The Epidemiology of Unintentional and Violence-Related Injury Morbidity and Mortality among Children and Adolescents in the United States

Michael F Ballesteros et al. Int J Environ Res Public Health. .

Abstract

Injuries and violence among young people have a substantial emotional, physical, and economic toll on society. Understanding the epidemiology of this public health problem can guide prevention efforts, help identify and reduce risk factors, and promote protective factors. We examined fatal and nonfatal unintentional injuries, injuries intentionally inflicted by other (i.e., assaults and homicides) among children ages 0-19, and intentionally self-inflicted injuries (i.e., self-harm and suicides) among children ages 10-19. We accessed deaths (1999-2015) and visits to emergency departments (2001-2015) for these age groups through the Centers for Disease Control and Prevention's (CDC) Web-based Injury Statistics Query and Reporting System (WISQARS), and examined trends and differences by age, sex, race/ethnicity, rural/urban status, and injury mechanism. Almost 13,000 children and adolescents age 0-19 years died in 2015 from injury and violence compared to over 17,000 in 1999. While the overall number of deaths has decreased over time, there were increases in death rates among certain age groups for some categories of unintentional injury and for suicides. The leading causes of injury varied by age group. Our results indicate that efforts to reduce injuries to children and adolescents should consider cause, intent, age, sex, race, and regional factors to assure that prevention resources are directed at those at greatest risk.

Keywords: adolescents; children; epidemiology; homicide; injury; suicide.


Conflict of interest statement

The authors declare no conflict of interest.

Figures

Figure 1
Figure 1
Injury and violence-related death rates (per 100,000 population) among youth aged 0–19 years by intent and age group, National Vital Statistics System, United States, 1999–2015.
Figure 2
Figure 2
Non-fatal injury rates (per 100,000 population) among youth aged 0–19 years by intent, age group, and year, National Electronic Injury Surveillance System-All Injury Program, United States, 2001–2015.
Figure 3
Figure 3
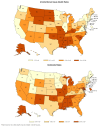
Injury and violence related death rates (per 100,000 population) among youth aged 0–19 years by intent and state, National Vital Statistics System, United States, 2009–2015. Note: data for Suicides is only for 10–19 year olds.
Figure 3
Figure 3
Injury and violence related death rates (per 100,000 population) among youth aged 0–19 years by intent and state, National Vital Statistics System, United States, 2009–2015. Note: data for Suicides is only for 10–19 year olds.
Figure 4
Figure 4
Injury and violence related death rates (per 100,000 population) among youth aged 0–19 years by intent and race, National Vital Statistics System, United States, 2013–2015.
Figure 5
Figure 5
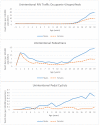
Injury and violence related death rates (per 100,000 population) among youth (ages 0–19 years) by intent, mechanism, and age group, National Vital Statistics System, United States, 2011–2015. Note: The scales for the vertical axes are different for each intent and mechanism.
Figure 5
Figure 5
Injury and violence related death rates (per 100,000 population) among youth (ages 0–19 years) by intent, mechanism, and age group, National Vital Statistics System, United States, 2011–2015. Note: The scales for the vertical axes are different for each intent and mechanism.
Figure 5
Figure 5
Injury and violence related death rates (per 100,000 population) among youth (ages 0–19 years) by intent, mechanism, and age group, National Vital Statistics System, United States, 2011–2015. Note: The scales for the vertical axes are different for each intent and mechanism.
Figure 5
Figure 5
Injury and violence related death rates (per 100,000 population) among youth (ages 0–19 years) by intent, mechanism, and age group, National Vital Statistics System, United States, 2011–2015. Note: The scales for the vertical axes are different for each intent and mechanism.

References

    1. Centers for Disease Control and Prevention Web-Based Injury Statistics Query and Reporting System (WISQARS) [(accessed on 9 August 2017)]; Available online: https://www.cdc.gov/injury/wisqars/
    1. Dellinger A.M., Gilchrist J. Leading Causes of Fatal and Nonfatal Unintentional Injury for Children and Teens and the Role of Lifestyle Clinicians. Am. J. Lifestyle Med. 2017 doi: 10.1177/1559827617696297. - DOI - PMC - PubMed
    1. Ballesteros M.F., Webb K., McClure R.J. A review of CDC’s Web-based Injury Statistics Query and Reporting System (WISQARS): Planning for the future of injury surveillance. J. Saf. Res. 2017;61:211–215. doi: 10.1016/j.jsr.2017.01.001. - DOI - PMC - PubMed
    1. Centers for Disease Control and Prevention Tools for Categorizing Injuries Using ICD Codes. [(accessed on 1 July 2017)]; Available online: https://www.cdc.gov/nchs/injury/injury_tools.htm.
    1. Ballesteros M. Motor vehicle occupant mortality coding: Comparison of NVSS and FARS; Proceedings of the SAVIR 2017 Conference: Innovations in Injury Prevention Science; Ann Arbor, MI, USA. 18–20 September 2017.

MeSH terms